IHOP 2009 Annual Report Download - page 97
Download and view the complete annual report
Please find page 97 of the 2009 IHOP annual report below. You can navigate through the pages in the report by either clicking on the pages listed below, or by using the keyword search tool below to find specific information within the annual report.-
 1
1 -
2
-
3
-
4
-
5
-
6
-
7
-
8
-
9
-
10
-
11
-
12
-
13
-
14
-
15
-
16
-
17
-
18
-
19
-
20
-
21
-
22
-
23
-
24
-
25
-
26
-
27
-
28
-
29
-
30
-
31
-
32
-
33
-
34
-
35
-
36
-
37
-
38
-
39
-
40
-
41
-
42
-
43
-
44
-
45
-
46
-
47
-
48
-
49
-
50
-
51
-
52
-
53
-
54
-
55
-
56
-
57
-
58
-
59
-
60
-
61
-
62
-
63
-
64
-
65
-
66
-
67
-
68
-
69
-
70
-
71
-
72
-
73
-
74
-
75
-
76
-
77
-
78
-
79
-
80
-
81
-
82
-
83
-
84
-
85
-
86
-
 87
87 -
 88
88 -
 89
89 -
 90
90 -
 91
91 -
 92
92 -
 93
93 -
 94
94 -
 95
95 -
 96
96 -
 97
97 -
 98
98 -
 99
99 -
 100
100 -
 101
101 -
 102
102 -
 103
103 -
 104
104 -
 105
105 -
 106
106 -
 107
107 -
108
-
109
-
110
-
111
-
112
-
113
-
114
-
115
-
116
-
117
-
118
-
119
-
120
-
121
-
122
-
123
-
124
-
125
-
126
-
127
-
128
-
129
-
130
-
131
-
132
-
133
-
134
-
135
-
136
-
137
-
138
-
139
-
140
-
141
-
142
-
143
-
144
-
145
-
146
-
147
-
148
-
149
-
150
-
151
-
152
-
153
-
154
-
155
-
156
-
157
-
158
-
159
-
160
-
161
-
162
-
163
-
164
-
165
-
166
-
167
-
168
-
169
-
170
-
171
-
172
-
173
-
174
 |
 |

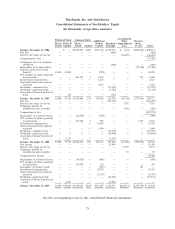
DineEquity, Inc. and Subsidiaries
Consolidated Statements of Stockholders’ Equity
(In thousands, except share amounts)
Accumulated
Preferred Stock Common Stock Additional Other Treasury
Shares Series B Shares Paid-in Retained Comprehensive Stock,
Issued Amount Issued Amount Capital Earnings Loss at cost Total
Balance, December 31, 2006 . . . — $ — 22,818,007 $227 $131,748 $ 358,975 $ (133) $(201,604) $ 289,213
Net loss ............... — — — — — (480) — — (480)
Interest rate swap, net of tax . . — — — — — — (36,605) — (36,605)
Comprehensive loss ........ (37,085)
Cumulative effect of adoption
of FIN 48 ............. — — — — — (489) — — (489)
Repurchase of treasury shares . — — — — — — — (77,020) (77,020)
Issuance of preferred stock
Series B ..............35,000 35,000 — — (750) — — — 34,250
Net issuance of shares pursuant
to stock plans .......... — — 541,657 3 8,925 — — 970 9,898
Stock-based compensation .... — — — — 6,165 — — — 6,165
Tax benefit from stock options
exercised ............. — — — — 3,476 — — — 3,476
Dividends—common stock .... — — — — — (17,293) — — (17,293)
Dividends—preferred stock . . . — — — — — (1,742) — — (1,742)
Accretion of Series B preferred
stock ................ — 181 — — — (181) — — —
Balance, December 31, 2007 . . . 35,000 35,181 23,359,664 230 149,564 338,790 (36,738) (277,654) 209,373
Net loss ............... — — — — — (154,459) — — (154,459)
Interest rate swap, net of tax . . — — — — — — 7,716 — 7,716
Temporary decline in
available-for-sale securities . . — — — — — — (386) — (386)
Comprehensive loss ........ (147,129)
Repurchase of restricted shares . — — (18,274) — (540) — — — (540)
Net issuance of shares pursuant
to stock plans .......... — — 355,560 7 982 — — 1,135 2,124
Stock-based compensation .... — — — — 13,445 — — — 13,445
Tax benefit from stock options
exercised ............. — — — — 1,864 — — — 1,864
Dividends—common stock .... — — — — — (17,370) — — (17,370)
Dividends—preferred stock . . . — — — — — (19,000) — — (19,000)
Accretion of Series B preferred
stock ................ — 2,151 — — — (2,151) — — —
Balance, December 31, 2008 . . . 35,000 37,332 23,696,950 237 165,315 145,810 (29,408) (276,519) 42,767
Net income ............. — — — — — 31,409 — 31,409
Interest rate swap, net of tax . . — — — — — — 8,507 — 8,507
Temporary decline in
available-for-sale securities . . — — — — — — 90 — 90
Comprehensive income ...... 40,006
Repurchase of restricted shares . — — (50,927) — (605) — — — (605)
Net issuance of shares pursuant
to stock plans .......... — — 133,992 1 323 — — — 324
Reissuance of treasury stock . . — — — — (769) — — 769 —
Stock-based compensation .... — — — — 10,710 — — — 10,710
Tax benefit from stock options
exercised ............. — — — — (3,767) — — — (3,767)
Dividends—preferred stock . . . — — — — — (19,531) — — (19,531)
Accretion of Series B preferred
stock ................ — 2,291 — — — (2,291) — — —
Balance, December 31, 2009 . . . 35,000 $39,623 23,780,015 $238 $171,207 $ 155,397 $(20,811) $(275,750) $ 69,904
See the accompanying notes to the consolidated financial statements.
78