IHOP 2009 Annual Report Download - page 59
Download and view the complete annual report
Please find page 59 of the 2009 IHOP annual report below. You can navigate through the pages in the report by either clicking on the pages listed below, or by using the keyword search tool below to find specific information within the annual report.-
 1
1 -
2
-
3
-
4
-
5
-
6
-
7
-
8
-
9
-
10
-
11
-
12
-
13
-
14
-
15
-
16
-
17
-
18
-
19
-
20
-
21
-
22
-
23
-
24
-
25
-
26
-
27
-
28
-
29
-
30
-
31
-
32
-
33
-
34
-
35
-
36
-
37
-
38
-
39
-
40
-
41
-
42
-
43
-
44
-
45
-
46
-
47
-
48
-
 49
49 -
 50
50 -
 51
51 -
 52
52 -
 53
53 -
 54
54 -
 55
55 -
 56
56 -
 57
57 -
 58
58 -
 59
59 -
 60
60 -
 61
61 -
 62
62 -
 63
63 -
 64
64 -
 65
65 -
 66
66 -
 67
67 -
 68
68 -
 69
69 -
70
-
71
-
72
-
73
-
74
-
75
-
76
-
77
-
78
-
79
-
80
-
81
-
82
-
83
-
84
-
85
-
86
-
87
-
88
-
89
-
90
-
91
-
92
-
93
-
94
-
95
-
96
-
97
-
98
-
99
-
100
-
101
-
102
-
103
-
104
-
105
-
106
-
107
-
108
-
109
-
110
-
111
-
112
-
113
-
114
-
115
-
116
-
117
-
118
-
119
-
120
-
121
-
122
-
123
-
124
-
125
-
126
-
127
-
128
-
129
-
130
-
131
-
132
-
133
-
134
-
135
-
136
-
137
-
138
-
139
-
140
-
141
-
142
-
143
-
144
-
145
-
146
-
147
-
148
-
149
-
150
-
151
-
152
-
153
-
154
-
155
-
156
-
157
-
158
-
159
-
160
-
161
-
162
-
163
-
164
-
165
-
166
-
167
-
168
-
169
-
170
-
171
-
172
-
173
-
174
 |
 |
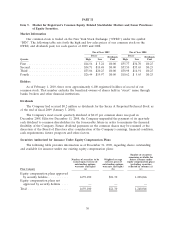
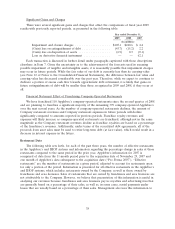
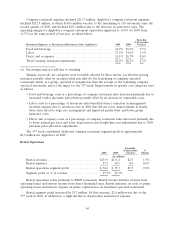
sales at Company-operated restaurants. Sales at restaurants that are owned by franchisees and area
licensees are not attributable to the Company.
(c) ‘‘Sales percentage change’’ reflects, for each category of restaurants, the percentage change in sales
in any given fiscal year compared to the prior fiscal year for all restaurants in that category. The
fiscal year ended December 31, 2009 contained 53 weeks. The fiscal years ended December 31,
2008 and 2007 each contained 52 weeks.
(d) ‘‘Same-store sales percentage change’’ reflects the percentage change in sales, in any given fiscal
year compared to the prior fiscal year, for restaurants that have been operated throughout both
fiscal periods that are being compared and have been open for at least 18 months. Because of new
unit openings and store closures, the restaurants open throughout both fiscal periods being
compared will be different from period to period. Same-store sales percentage change does not
include data on IHOP restaurants located in Florida.
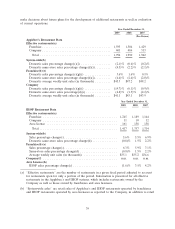
(e) Applebee’s domestic franchise restaurant sales were $3.5 billion, $3.4 billion and $3.3 billion in the
fiscal years ended December 31, 2009, 2008, and 2007, respectively. Domestic franchise sales for
Applebee’s restaurants in the 2007 period subsequent to the acquisition date were $319.5 million.
IHOP franchise restaurant sales were $2.3 billion, $2.2 billion and $2.1 billion for the fiscal years
ended December 31, 2009, 2008 and 2007, respectively.
(f) Sales percentage change and same-store sales percentage change for IHOP company-operated
restaurants are not meaningful due to the relatively small number and test-market nature of the
restaurants, along with the periodic inclusion of restaurants reacquired from franchisees that are
temporarily operated by the Company.
(g) The sales percentage change for Applebee’s franchise and company-operated restaurants is
impacted by the franchising of 103 company-operated restaurants during 2008 and seven company-
operated restaurants in 2009.
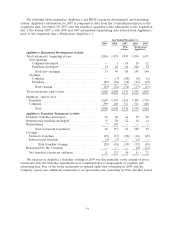
(h) IHOP area license restaurants are located in Florida and Georgia in the U.S and in British
Columbia, Canada. Sales at IHOP area license restaurants were $214.9 million, $218.4 million and
$211.9 million for the fiscal years ended December 31, 2009, 2008 and 2007, respectively.
(i) We acquired Applebee’s on November 29, 2007. The change in domestic system store sales was
(3.1)% and (4.8)%, respectively, for the five-week period in the 2007 period subsequent to the
acquisition date. The change in domestic franchise restaurant store sales and same-store sales, as
reported to the Company, was (2.4)% and (5.0)%, respectively, for the five-week period in the
2007 period subsequent to the acquisition date. The change in Applebee’s store sales and
same-store sales was (5.1)% and (4.5)%, respectively, for the five-week period in the 2007 period
subsequent to the acquisition date.
40