IHOP 2009 Annual Report Download - page 56
Download and view the complete annual report
Please find page 56 of the 2009 IHOP annual report below. You can navigate through the pages in the report by either clicking on the pages listed below, or by using the keyword search tool below to find specific information within the annual report.-
 1
1 -
2
-
3
-
4
-
5
-
6
-
7
-
8
-
9
-
10
-
11
-
12
-
13
-
14
-
15
-
16
-
17
-
18
-
19
-
20
-
21
-
22
-
23
-
24
-
25
-
26
-
27
-
28
-
29
-
30
-
31
-
32
-
33
-
34
-
35
-
36
-
37
-
38
-
39
-
40
-
41
-
42
-
43
-
44
-
45
-
 46
46 -
 47
47 -
 48
48 -
 49
49 -
 50
50 -
 51
51 -
 52
52 -
 53
53 -
 54
54 -
 55
55 -
 56
56 -
 57
57 -
 58
58 -
 59
59 -
 60
60 -
 61
61 -
 62
62 -
 63
63 -
 64
64 -
 65
65 -
 66
66 -
67
-
68
-
69
-
70
-
71
-
72
-
73
-
74
-
75
-
76
-
77
-
78
-
79
-
80
-
81
-
82
-
83
-
84
-
85
-
86
-
87
-
88
-
89
-
90
-
91
-
92
-
93
-
94
-
95
-
96
-
97
-
98
-
99
-
100
-
101
-
102
-
103
-
104
-
105
-
106
-
107
-
108
-
109
-
110
-
111
-
112
-
113
-
114
-
115
-
116
-
117
-
118
-
119
-
120
-
121
-
122
-
123
-
124
-
125
-
126
-
127
-
128
-
129
-
130
-
131
-
132
-
133
-
134
-
135
-
136
-
137
-
138
-
139
-
140
-
141
-
142
-
143
-
144
-
145
-
146
-
147
-
148
-
149
-
150
-
151
-
152
-
153
-
154
-
155
-
156
-
157
-
158
-
159
-
160
-
161
-
162
-
163
-
164
-
165
-
166
-
167
-
168
-
169
-
170
-
171
-
172
-
173
-
174
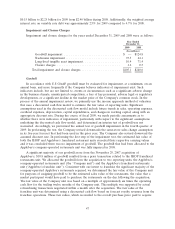
 |
 |

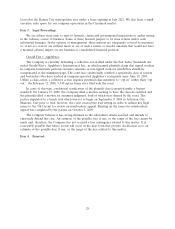
• reduced cash flows from franchisees due to both a lower sales base on which royalties and other
payments are calculated and possible impairment of the ability of franchisees to make payments
when due as a result of the economic effects cited above on their businesses;
• reduced availability of financing for franchisees to fulfill their new restaurant development
commitments;
• limited or lack of credit availability for potential purchasers of Applebee’s company-operated
restaurants;
• lower proceeds from the franchising of Applebee’s company-operated restaurants due to both
lower restaurant sales and profitability and/or inability to consummate transactions at all; and
• lower estimated fair values for goodwill, intangible assets and long-lived assets resulting in future
non-cash impairment charges.
We cannot predict the effect or duration of this economic slowdown or the timing and strength of
a subsequent recovery in the economy in general or the restaurant industry in particular. If our
business significantly deteriorates due to these macroeconomic effects, our financial condition and
results of operations will likely be materially and adversely affected.
Fifty-Three Week Fiscal Year
Our fiscal year ends on the Sunday nearest to December 31 of each year. As a result, every five or
six years our fiscal year contains 53 calendar weeks. Fiscal 2009 contained 53 weeks whereas fiscal 2008
and 2007 each contained 52 weeks. The estimated impact of the 53rd week in fiscal 2009 in comparison
to fiscal 2008 was an increase in revenue of $29.2 million, an increase in segment profit of $13.5 million
and an increase in income before income taxes of $10.9 million. While certain expenses increased in
direct relationship to additional revenue from the 53rd week, other costs (for example, depreciation
and other fixed costs) are incurred on a calendar month basis. Therefore, the impact of the additional
week is not necessarily indicative of a typical relationship of expenses to revenues measured over a
longer period of comparison, such as a fiscal month or a fiscal quarter.
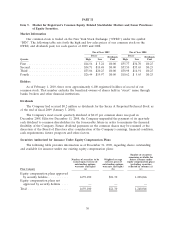
Securitized Debt and Related Interest Expense
Certain of our subsidiaries incurred a substantial amount of indebtedness to finance the
Applebee’s acquisition. Because of early retirement of debt and a decline in variable interest rates, our
interest expense decreased $16.7 million from the prior year. While it is not likely interest rates on our
variable-rate debt will continue to decline significantly below current levels and may, in fact, increase in
the future, we will amortize debt in the normal course of business and we intend to use excess
operating cash flow to repurchase debt when the opportunity is available. As a result we expect our
total interest expense will decline. We estimate our interest expense for fiscal 2010 will range from
$175 million to $180 million, which includes $40 million of non-cash interest charges. However, interest
expense is expected to remain as one of the largest components of costs and expenses in the future
until such time that debt balances are repaid.
37