IHOP 2009 Annual Report Download - page 83
Download and view the complete annual report
Please find page 83 of the 2009 IHOP annual report below. You can navigate through the pages in the report by either clicking on the pages listed below, or by using the keyword search tool below to find specific information within the annual report.-
 1
1 -
2
-
3
-
4
-
5
-
6
-
7
-
8
-
9
-
10
-
11
-
12
-
13
-
14
-
15
-
16
-
17
-
18
-
19
-
20
-
21
-
22
-
23
-
24
-
25
-
26
-
27
-
28
-
29
-
30
-
31
-
32
-
33
-
34
-
35
-
36
-
37
-
38
-
39
-
40
-
41
-
42
-
43
-
44
-
45
-
46
-
47
-
48
-
49
-
50
-
51
-
52
-
53
-
54
-
55
-
56
-
57
-
58
-
59
-
60
-
61
-
62
-
63
-
64
-
65
-
66
-
67
-
68
-
69
-
70
-
71
-
72
-
 73
73 -
 74
74 -
 75
75 -
 76
76 -
 77
77 -
 78
78 -
 79
79 -
 80
80 -
 81
81 -
 82
82 -
 83
83 -
 84
84 -
 85
85 -
 86
86 -
 87
87 -
 88
88 -
 89
89 -
 90
90 -
 91
91 -
 92
92 -
 93
93 -
94
-
95
-
96
-
97
-
98
-
99
-
100
-
101
-
102
-
103
-
104
-
105
-
106
-
107
-
108
-
109
-
110
-
111
-
112
-
113
-
114
-
115
-
116
-
117
-
118
-
119
-
120
-
121
-
122
-
123
-
124
-
125
-
126
-
127
-
128
-
129
-
130
-
131
-
132
-
133
-
134
-
135
-
136
-
137
-
138
-
139
-
140
-
141
-
142
-
143
-
144
-
145
-
146
-
147
-
148
-
149
-
150
-
151
-
152
-
153
-
154
-
155
-
156
-
157
-
158
-
159
-
160
-
161
-
162
-
163
-
164
-
165
-
166
-
167
-
168
-
169
-
170
-
171
-
172
-
173
-
174
 |
 |

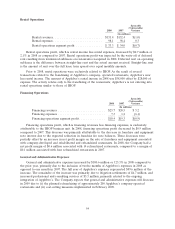
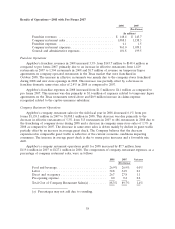
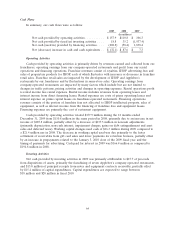
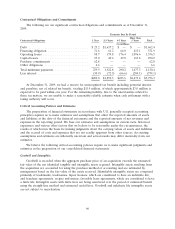
Cash Flows
In summary, our cash flows were as follows:
2009 2008 2007
(In millions)
Net cash provided by operating activities ........... $157.9 $110.8 $ 106.3
Net cash provided by (used in) investing activities .... 18.8 35.2 (1,937.4)
Net cash (used in) provided by financing activities .... (208.8) (58.4) 1,838.4
Net (decrease) increase in cash and cash equivalents . . $ (32.1) $ 87.6 $ 7.3
Operating Activities
Cash provided by operating activities is primarily driven by revenues earned and collected from our
franchisees, operating earnings from our company-operated restaurants and profit from our rental
operations and financing operations. Franchise revenues consist of royalties, IHOP advertising fees and
sales of proprietary products for IHOP, each of which fluctuates with increases or decreases in franchise
retail sales. Franchise retail sales are impacted by the development of IHOP and Applebee’s
restaurants by our franchisees and by fluctuations in same-store sales. Operating earnings from
company-operated restaurants are impacted by many factors which include but are not limited to
changes in traffic patterns, pricing activities and changes in operating expenses. Rental operations profit
is rental income less rental expenses. Rental income includes revenues from operating leases and
interest income from direct financing leases. Rental expenses are costs of prime operating leases and
interest expense on prime capital leases on franchisee-operated restaurants. Financing operations
revenue consists of the portion of franchise fees not allocated to IHOP intellectual property, sales of
equipment, as well as interest income from the financing of franchise fees and equipment leases.
Financing expenses are primarily the cost of restaurant equipment.
Cash provided by operating activities totaled $157.9 million during the 12 months ended
December 31, 2009 from $110.8 million in the same period in 2008, primarily due to an increase in net
income of $185.8 million, partially offset by a decrease of $137.5 million in noncash adjustments
(primarily depreciation, non-cash interest, impairment charges, gains on debt extinguishment and asset
sales and deferred taxes). Working capital changes used cash of $16.3 million during 2009 compared to
a $21.4 million use in 2008. The decrease in working capital used was due primarily to the faster
settlement of receivables from gift card sales and lower payments for retention bonuses, partially offset
by an increase in prepayments related to the January 3, 2010 close of the 2009 fiscal year and the
timing of payments for advertising. Cash paid for interest in 2009 was $166.4 million as compared to
$194.8 million in 2008.
Investing Activities
Net cash provided by investing activities in 2009 was primarily attributable to $15.7 of proceeds
from dispositions of assets, primarily the franchising of seven Applebee’s company-operated restaurants,
and $15.0 million of principal receipts from notes and equipment contracts receivable, partially offset
by $15.4 million of capital expenditures. Capital expenditures are expected to range between
$18 million and $20 million in fiscal 2010.
64