IHOP 2009 Annual Report Download - page 73
Download and view the complete annual report
Please find page 73 of the 2009 IHOP annual report below. You can navigate through the pages in the report by either clicking on the pages listed below, or by using the keyword search tool below to find specific information within the annual report.-
 1
1 -
2
-
3
-
4
-
5
-
6
-
7
-
8
-
9
-
10
-
11
-
12
-
13
-
14
-
15
-
16
-
17
-
18
-
19
-
20
-
21
-
22
-
23
-
24
-
25
-
26
-
27
-
28
-
29
-
30
-
31
-
32
-
33
-
34
-
35
-
36
-
37
-
38
-
39
-
40
-
41
-
42
-
43
-
44
-
45
-
46
-
47
-
48
-
49
-
50
-
51
-
52
-
53
-
54
-
55
-
56
-
57
-
58
-
59
-
60
-
61
-
62
-
 63
63 -
 64
64 -
 65
65 -
 66
66 -
 67
67 -
 68
68 -
 69
69 -
 70
70 -
 71
71 -
 72
72 -
 73
73 -
 74
74 -
 75
75 -
 76
76 -
 77
77 -
 78
78 -
 79
79 -
 80
80 -
 81
81 -
 82
82 -
 83
83 -
84
-
85
-
86
-
87
-
88
-
89
-
90
-
91
-
92
-
93
-
94
-
95
-
96
-
97
-
98
-
99
-
100
-
101
-
102
-
103
-
104
-
105
-
106
-
107
-
108
-
109
-
110
-
111
-
112
-
113
-
114
-
115
-
116
-
117
-
118
-
119
-
120
-
121
-
122
-
123
-
124
-
125
-
126
-
127
-
128
-
129
-
130
-
131
-
132
-
133
-
134
-
135
-
136
-
137
-
138
-
139
-
140
-
141
-
142
-
143
-
144
-
145
-
146
-
147
-
148
-
149
-
150
-
151
-
152
-
153
-
154
-
155
-
156
-
157
-
158
-
159
-
160
-
161
-
162
-
163
-
164
-
165
-
166
-
167
-
168
-
169
-
170
-
171
-
172
-
173
-
174
 |
 |

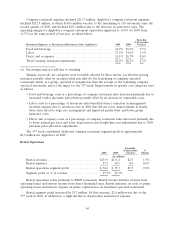
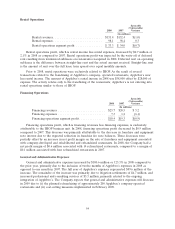
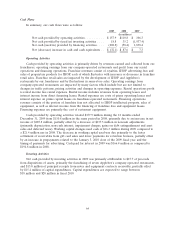
Rental Operations
Favorable
(Unfavorable)
2008 2007 Variance
(In millions)
Rental revenues ............................ $131.4 $132.4 $(1.0)
Rental expenses ............................ 98.1 98.4 0.3
Rental operations segment profit ............... $ 33.3 $ 34.0 $(0.7)
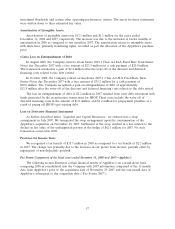
Rental operations profit, which is rental income less rental expenses, decreased by $0.7 million or
2.1% in 2008 as compared to 2007. Rental operations profit was impacted by the write-off of deferred
rent resulting from terminated subleases on restaurants reacquired in 2008. Deferred rent on operating
subleases is the difference between straight-line rent and the actual amount received. Straight-line rent
is the amount of rent over the full lease term spread over equal monthly amounts.
Prior to 2008, rental operations were exclusively related to IHOP. As the result of several
transactions related to the franchising of Applebee’s company- operated restaurants, Applebee’s now
has rental income. The amount of Applebee’s rental income in 2008 was $58,000 offset by $28,000 of
expense. The activity relates only to the franchising of the restaurants; Applebee’s is not entering into
rental operations similar to those of IHOP.
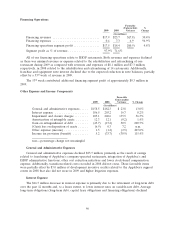
Financing Operations
Favorable
(Unfavorable)
2008 2007 Variance
(In millions)
Financing revenues ........................... $25.7 $20.5 $ 5.2
Financing expenses ........................... 7.3 1.2 (6.1)
Financing operations segment profit ............... $18.4 $19.3 $(0.9)
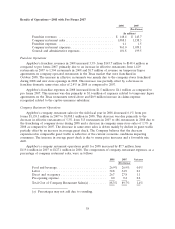
Financing operations profit, which is financing revenues less financing expenses, is exclusively
attributable to the IHOP business unit. In 2008, financing operations profit decreased by $0.9 million
compared to 2007. This decrease was primarily attributable to the decrease in franchise and equipment
note interest due to the expected reduction in franchise fee note balances. These decreases were
partially offset by an increase in net profit margin on the sale of franchises and equipment associated
with company-developed and rehabilitated and refranchised restaurants. In 2008, the Company had a
net profit margin of $0.6 million associated with 14 refranchised restaurants, compared to a margin of
$0.1 million associated with four refranchised restaurants in 2007.
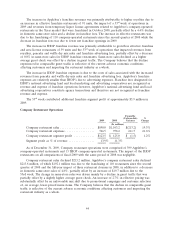
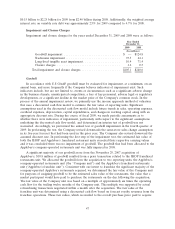
General and Administrative Expenses
General and administrative expenses increased by $100.6 million or 123.3% in 2008 compared to
the prior year, primarily due to the inclusion of twelve months of Applebee’s expenses in 2008 as
opposed to one month in 2007. The full year of Applebee’s expenses represented $89.6 million of the
increase. The remainder of the increase was primarily due to litigation settlements of $4.7 million, and
increased professional and consulting services of $5.3 million, primarily related to the ongoing
integration of Applebee’s. The Company expects that general and administrative expenses will decrease
in 2009 due to (i) the planned refranchising of approximately 200 Applebee’s company-operated
restaurants and (ii) cost-cutting measures implemented in February 2009.
54