IHOP 2009 Annual Report Download - page 106
Download and view the complete annual report
Please find page 106 of the 2009 IHOP annual report below. You can navigate through the pages in the report by either clicking on the pages listed below, or by using the keyword search tool below to find specific information within the annual report.-
 1
1 -
2
-
3
-
4
-
5
-
6
-
7
-
8
-
9
-
10
-
11
-
12
-
13
-
14
-
15
-
16
-
17
-
18
-
19
-
20
-
21
-
22
-
23
-
24
-
25
-
26
-
27
-
28
-
29
-
30
-
31
-
32
-
33
-
34
-
35
-
36
-
37
-
38
-
39
-
40
-
41
-
42
-
43
-
44
-
45
-
46
-
47
-
48
-
49
-
50
-
51
-
52
-
53
-
54
-
55
-
56
-
57
-
58
-
59
-
60
-
61
-
62
-
63
-
64
-
65
-
66
-
67
-
68
-
69
-
70
-
71
-
72
-
73
-
74
-
75
-
76
-
77
-
78
-
79
-
80
-
81
-
82
-
83
-
84
-
85
-
86
-
87
-
88
-
89
-
90
-
91
-
92
-
93
-
94
-
95
-
 96
96 -
 97
97 -
 98
98 -
 99
99 -
 100
100 -
 101
101 -
 102
102 -
 103
103 -
 104
104 -
 105
105 -
 106
106 -
 107
107 -
 108
108 -
 109
109 -
 110
110 -
 111
111 -
 112
112 -
 113
113 -
 114
114 -
 115
115 -
 116
116 -
117
-
118
-
119
-
120
-
121
-
122
-
123
-
124
-
125
-
126
-
127
-
128
-
129
-
130
-
131
-
132
-
133
-
134
-
135
-
136
-
137
-
138
-
139
-
140
-
141
-
142
-
143
-
144
-
145
-
146
-
147
-
148
-
149
-
150
-
151
-
152
-
153
-
154
-
155
-
156
-
157
-
158
-
159
-
160
-
161
-
162
-
163
-
164
-
165
-
166
-
167
-
168
-
169
-
170
-
171
-
172
-
173
-
174
 |
 |
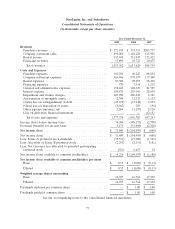
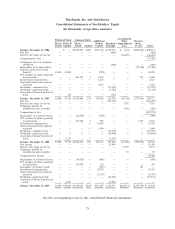
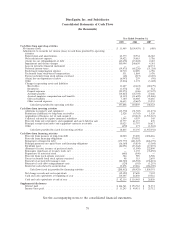
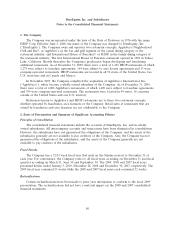
DineEquity, Inc. and Subsidiaries
Notes to the Consolidated Financial Statements (Continued)
2. Basis of Presentation and Summary of Significant Accounting Policies (Continued)
financial statements as company restaurant expenses. At both December 31, 2009 and 2008, the liability
recorded for asset retirement obligations was $0.3 million.
Derivative Financial Instruments
The Company accounts for derivative instruments and hedging activities in accordance with
U.S. GAAP. All derivatives are recognized on the balance sheet at their fair value. On the date that the
Company enters into a derivative contract, management formally documents all relationships between
hedging instruments and hedged items, as well as risk management objectives and strategies for
undertaking various hedge transactions.
Changes in the fair value of a derivative that is highly effective and that is designated and qualifies
as a cash flow hedge (a ‘‘swap’’), to the extent that the hedge is effective, are recorded in accumulated
other comprehensive income, until earnings are affected by the variability of cash flows of the hedged
transaction. The Company measures effectiveness of the swap at each quarter end, using the
hypothetical derivative method. Under this method, hedge effectiveness is measured based on a
comparison of the change in fair value of the actual swap designated as the hedging instrument and the
change in fair value of the hypothetical swap which would have the terms that identically match the
critical terms of the hedged cash flows from the anticipated debt issuance. The amount of
ineffectiveness, if any, recorded in earnings would be equal to the excess of the cumulative change in
the fair value of the swap over the cumulative change in the fair value of the plain vanilla swap lock, as
defined in the accounting literature. Once a swap is settled, the effective portion is amortized over the
estimated life of the hedged item.
In the past, the Company has utilized derivative financial instruments to manage its exposure to
interest rate risks. The Company has not entered into any derivative financial instruments since an
interest rate swap entered into in conjunction with the acquisition of Applebee’s was terminated in
2007 (See Note 8, Debt). The Company does not enter into derivative financial instruments for trading
purposes.
Fair Value Measurements
Effective January 1, 2008, the Company determines the fair market values of its financial assets
and liabilities, as well as non-financial assets and liabilities that are recognized or disclosed at fair value
on a recurring basis, based on the fair value hierarchy established in U.S. GAAP. The Company
measures its financial assets and liabilities using inputs from the following three levels of the fair value
hierarchy. The three levels are as follows:
• Level 1 inputs are unadjusted quoted prices in active markets for identical assets or liabilities
that the Company has the ability to access at the measurement date.
• Level 2 inputs include quoted prices for similar assets and liabilities in active markets, quoted
prices for identical or similar assets or liabilities in markets that are not active, inputs other than
quoted prices that are observable for the asset or liability (i.e., interest rates, yield curves, etc.),
and inputs that are derived principally from or corroborated by observable market data by
correlation or other means (market corroborated inputs).
• Level 3 includes unobservable inputs that reflect our assumptions about the assumptions that
market participants would use in pricing the asset or liability. The Company develops these
inputs based on the best information available, including our own data.
87