IHOP 2009 Annual Report Download - page 64
Download and view the complete annual report
Please find page 64 of the 2009 IHOP annual report below. You can navigate through the pages in the report by either clicking on the pages listed below, or by using the keyword search tool below to find specific information within the annual report.-
 1
1 -
2
-
3
-
4
-
5
-
6
-
7
-
8
-
9
-
10
-
11
-
12
-
13
-
14
-
15
-
16
-
17
-
18
-
19
-
20
-
21
-
22
-
23
-
24
-
25
-
26
-
27
-
28
-
29
-
30
-
31
-
32
-
33
-
34
-
35
-
36
-
37
-
38
-
39
-
40
-
41
-
42
-
43
-
44
-
45
-
46
-
47
-
48
-
49
-
50
-
51
-
52
-
53
-
 54
54 -
 55
55 -
 56
56 -
 57
57 -
 58
58 -
 59
59 -
 60
60 -
 61
61 -
 62
62 -
 63
63 -
 64
64 -
 65
65 -
 66
66 -
 67
67 -
 68
68 -
 69
69 -
 70
70 -
 71
71 -
 72
72 -
 73
73 -
 74
74 -
75
-
76
-
77
-
78
-
79
-
80
-
81
-
82
-
83
-
84
-
85
-
86
-
87
-
88
-
89
-
90
-
91
-
92
-
93
-
94
-
95
-
96
-
97
-
98
-
99
-
100
-
101
-
102
-
103
-
104
-
105
-
106
-
107
-
108
-
109
-
110
-
111
-
112
-
113
-
114
-
115
-
116
-
117
-
118
-
119
-
120
-
121
-
122
-
123
-
124
-
125
-
126
-
127
-
128
-
129
-
130
-
131
-
132
-
133
-
134
-
135
-
136
-
137
-
138
-
139
-
140
-
141
-
142
-
143
-
144
-
145
-
146
-
147
-
148
-
149
-
150
-
151
-
152
-
153
-
154
-
155
-
156
-
157
-
158
-
159
-
160
-
161
-
162
-
163
-
164
-
165
-
166
-
167
-
168
-
169
-
170
-
171
-
172
-
173
-
174
 |
 |

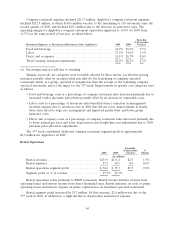
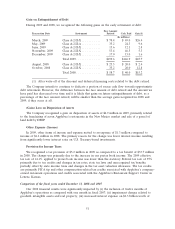
Company restaurant expenses declined $211.7 million. Applebee’s company restaurant expenses
declined $212.5 million, of which $169.6 million was due to the franchising of 110 restaurants since the
second quarter of 2008, and declined $25.6 million due to the decrease in same-store sales. The
operating margin for Applebee’s company restaurant operations improved to 14.4% for 2009 from
11.7% for the same period of last year, as shown below:
Favorable
(Unfavorable)
Restaurant Expenses as Percentage of Restaurant Sales (Applebee’s) 2009 2008 Variance
Food and beverage .................................. 26.2% 26.9% 0.7%
Labor ............................................ 33.3% 34.8% 1.5%
Direct and occupancy ................................ 26.1% 26.7% 0.6%
Total Company restaurant expenses(a) .................... 85.6% 88.3% 2.7%
(a) Percentages may not add due to rounding.
Margins across all cost categories were favorably affected by three factors: (a) effective pricing
increases partially offset by an unfavorable mix shift (b) the franchising of company-operated
restaurants which, as a group, operated at margins less than the average of the remaining company-
operated restaurants and (c) the impact of the 53rd week. Improvements in specific cost categories were
as follows:
• Food and beverage costs as a percentage of company restaurant sales decreased primarily due to
increased vendor discounts and rebates partially offset by an increase in commodity costs.
• Labor costs as a percentage of restaurant sales benefited from a reduction in management
incentive expense due to retention costs in 2008 that did not recur, improvements in hourly
labor from effective wage rate management and improved productivity, and lower group
insurance costs.
• Direct and occupancy costs as a percentage of company restaurant sales decreased primarily due
to lower natural gas rates and lower depreciation and straight-line rent adjustments due to 2008
purchase price allocation adjustments.
The 53rd week contributed additional company restaurant segment profit of approximately
$4.9 million for Applebee’s in 2009.
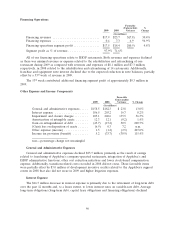
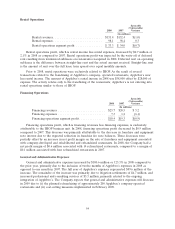
Rental Operations
Favorable
(Unfavorable) %
2009 2008 Variance Change
(In millions)
Rental revenues ............................ $133.9 $131.4 $2.5 1.9%
Rental expenses ............................ 97.3 98.1 0.8 0.8%
Rental operations segment profit ............... $ 36.6 $ 33.3 $3.3 9.8%
Segment profit as % of revenue ................ 27.3% 25.3%
Rental operations relate primarily to IHOP restaurants. Rental income includes revenue from
operating leases and interest income from direct financing leases. Rental expenses are costs of prime
operating leases and interest expense on prime capital leases on franchisee-operated restaurants.
Rental segment profit increased by $3.3 million. Of that increase, $2.4 million was due to the
53rd week in 2009, in addition to a slight decline in depreciation and interest expense.
45