IHOP 2009 Annual Report Download - page 71
Download and view the complete annual report
Please find page 71 of the 2009 IHOP annual report below. You can navigate through the pages in the report by either clicking on the pages listed below, or by using the keyword search tool below to find specific information within the annual report.-
 1
1 -
2
-
3
-
4
-
5
-
6
-
7
-
8
-
9
-
10
-
11
-
12
-
13
-
14
-
15
-
16
-
17
-
18
-
19
-
20
-
21
-
22
-
23
-
24
-
25
-
26
-
27
-
28
-
29
-
30
-
31
-
32
-
33
-
34
-
35
-
36
-
37
-
38
-
39
-
40
-
41
-
42
-
43
-
44
-
45
-
46
-
47
-
48
-
49
-
50
-
51
-
52
-
53
-
54
-
55
-
56
-
57
-
58
-
59
-
60
-
 61
61 -
 62
62 -
 63
63 -
 64
64 -
 65
65 -
 66
66 -
 67
67 -
 68
68 -
 69
69 -
 70
70 -
 71
71 -
 72
72 -
 73
73 -
 74
74 -
 75
75 -
 76
76 -
 77
77 -
 78
78 -
 79
79 -
 80
80 -
 81
81 -
82
-
83
-
84
-
85
-
86
-
87
-
88
-
89
-
90
-
91
-
92
-
93
-
94
-
95
-
96
-
97
-
98
-
99
-
100
-
101
-
102
-
103
-
104
-
105
-
106
-
107
-
108
-
109
-
110
-
111
-
112
-
113
-
114
-
115
-
116
-
117
-
118
-
119
-
120
-
121
-
122
-
123
-
124
-
125
-
126
-
127
-
128
-
129
-
130
-
131
-
132
-
133
-
134
-
135
-
136
-
137
-
138
-
139
-
140
-
141
-
142
-
143
-
144
-
145
-
146
-
147
-
148
-
149
-
150
-
151
-
152
-
153
-
154
-
155
-
156
-
157
-
158
-
159
-
160
-
161
-
162
-
163
-
164
-
165
-
166
-
167
-
168
-
169
-
170
-
171
-
172
-
173
-
174
 |
 |

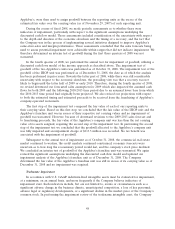
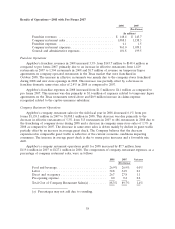
funded debt; and (iv) a loss on a derivative financial instrument in 2007 that did not recur in 2008. In
comparing the Company’s financial results for 2008 to those in 2007, we note:
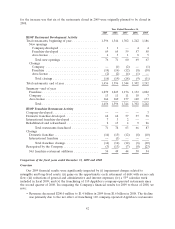
• Total revenues increased $1.1 billion from $0.5 billion in 2007 to $1.6 billion in 2008, with
revenues from Applebee’s company restaurant sales comprising more than two-thirds of total
revenue.
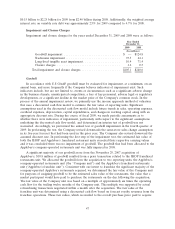
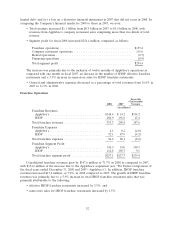
• Segment profit for fiscal 2008 increased $254.4 million, comprised as follows:
Franchise operations ......................................... $139.4
Company restaurant operations ................................. 116.6
Rental operations ........................................... (0.7)
Financing operations ......................................... (0.9)
Total segment profit ......................................... $254.4
The increase was primarily due to the inclusion of twelve months of Applebee’s operations as
compared with one month in fiscal 2007, an increase in the number of IHOP effective franchise
restaurants and a 3.5% increase in same-store sales for IHOP franchise restaurants.
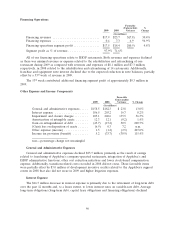
• General and administrative expenses decreased as a percentage of total revenues from 16.8% in
2007 to 11.3% in 2008.
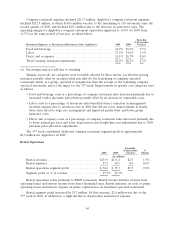
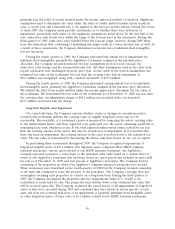
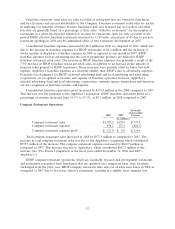
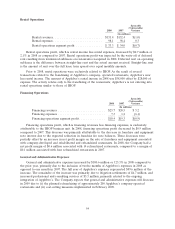
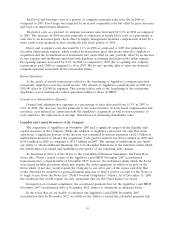
Franchise Operations
Favorable
(Unfavorable)
2008 2007 Variance
(In millions)
Franchise Revenues
Applebee’s .............................. $148.4 $ 14.2 $134.2
IHOP ................................. 204.9 191.6 13.4
Total franchise revenues ...................... 353.3 205.8 147.6
Franchise Expenses
Applebee’s .............................. 4.1 0.2 (4.0)
IHOP ................................. 92.1 87.9 (4.2)
Total franchise expenses ...................... 96.2 88.1 (8.2)
Franchise Segment Profit
Applebee’s .............................. 144.3 14.0 130.3
IHOP ................................. 112.8 103.7 9.1
Total franchise segment profit ................. $257.1 $117.7 $139.4
Consolidated franchise revenues grew by $147.6 million or 71.7% in 2008 as compared to 2007,
with $134.2 million of the increase due to the Applebee’s acquisition (see ‘‘Pro Forma Comparison of
the fiscal years ended December 31, 2008 and 2007—Applebee’s’’). In addition, IHOP franchise
revenues increased $13.4 million, or 7.0%, in 2008 compared to 2007. The growth in IHOP franchise
revenues was primarily due to a 5.9% increase in total IHOP franchise restaurant sales that was
primarily attributable to the following:
• effective IHOP franchise restaurants increased by 3.9%; and
• same-store sales for IHOP franchise restaurants increased by 1.5%.
52