IHOP 2009 Annual Report Download - page 114
Download and view the complete annual report
Please find page 114 of the 2009 IHOP annual report below. You can navigate through the pages in the report by either clicking on the pages listed below, or by using the keyword search tool below to find specific information within the annual report.-
 1
1 -
2
-
3
-
4
-
5
-
6
-
7
-
8
-
9
-
10
-
11
-
12
-
13
-
14
-
15
-
16
-
17
-
18
-
19
-
20
-
21
-
22
-
23
-
24
-
25
-
26
-
27
-
28
-
29
-
30
-
31
-
32
-
33
-
34
-
35
-
36
-
37
-
38
-
39
-
40
-
41
-
42
-
43
-
44
-
45
-
46
-
47
-
48
-
49
-
50
-
51
-
52
-
53
-
54
-
55
-
56
-
57
-
58
-
59
-
60
-
61
-
62
-
63
-
64
-
65
-
66
-
67
-
68
-
69
-
70
-
71
-
72
-
73
-
74
-
75
-
76
-
77
-
78
-
79
-
80
-
81
-
82
-
83
-
84
-
85
-
86
-
87
-
88
-
89
-
90
-
91
-
92
-
93
-
94
-
95
-
96
-
97
-
98
-
99
-
100
-
101
-
102
-
103
-
 104
104 -
 105
105 -
 106
106 -
 107
107 -
 108
108 -
 109
109 -
 110
110 -
 111
111 -
 112
112 -
 113
113 -
 114
114 -
 115
115 -
 116
116 -
 117
117 -
 118
118 -
 119
119 -
 120
120 -
 121
121 -
 122
122 -
 123
123 -
 124
124 -
125
-
126
-
127
-
128
-
129
-
130
-
131
-
132
-
133
-
134
-
135
-
136
-
137
-
138
-
139
-
140
-
141
-
142
-
143
-
144
-
145
-
146
-
147
-
148
-
149
-
150
-
151
-
152
-
153
-
154
-
155
-
156
-
157
-
158
-
159
-
160
-
161
-
162
-
163
-
164
-
165
-
166
-
167
-
168
-
169
-
170
-
171
-
172
-
173
-
174
 |
 |

DineEquity, Inc. and Subsidiaries
Notes to the Consolidated Financial Statements (Continued)
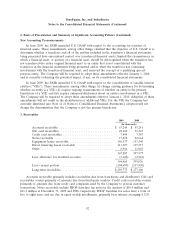
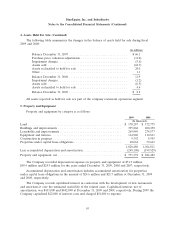
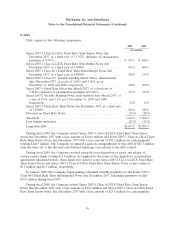
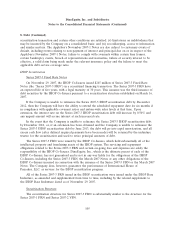
4. Assets Held For Sale (Continued)
The following table summarizes the changes in the balance of assets held for sale during fiscal
2009 and 2008:
(in millions)
Balance December 31, 2007 ................................. $66.1
Purchase price valuation adjustments .......................... (11.0)
Impairment charges ....................................... (5.6)
Assets sold ............................................. (62.7)
Assets reclassified to held for sale ............................ 24.0
Other ................................................. 1.1
Balance December 31, 2008 ................................. 11.9
Impairment charges ....................................... (1.2)
Assets sold ............................................. (6.5)
Assets reclassified to held for sale ............................ 4.6
Balance December 31, 2009 ................................. $ 8.8
All assets reported as held for sale are part of the company restaurant operations segment.
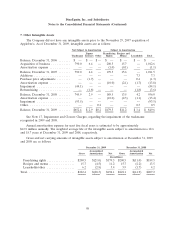
5. Property and Equipment
Property and equipment by category is as follows:
2009 2008
(In thousands)
Land ..................................................... $ 170,287 $ 172,775
Buildings and improvements .................................... 395,868 400,250
Leaseholds and improvements ................................... 269,949 274,577
Equipment and fixtures ........................................ 114,920 110,811
Construction in progress ....................................... 9,392 5,955
Properties under capital lease obligations ........................... 60,064 59,643
1,020,480 1,024,011
Less accumulated depreciation and amortization ...................... (249,108) (199,529)
Property and equipment, net .................................... $ 771,372 $ 824,482
The Company recorded depreciation expense on property and equipment of $51.9 million,
$58.9 million and $24.9 million for the years ended December 31, 2009, 2008 and 2007, respectively.
Accumulated depreciation and amortization includes accumulated amortization for properties
under capital lease obligations in the amount of $24.6 million and $21.7 million at December 31, 2009
and 2008, respectively.
The Company records capitalized interest in connection with the development of new restaurants
and amortizes it over the estimated useful life of the related asset. Capitalized interest, net of
amortization, was $413,000 and $442,000 at December 31, 2009 and 2008, respectively. During 2009 the
Company capitalized $22,000 of interest costs and charged $51,000 to expense.
95