IHOP 2009 Annual Report Download - page 80
Download and view the complete annual report
Please find page 80 of the 2009 IHOP annual report below. You can navigate through the pages in the report by either clicking on the pages listed below, or by using the keyword search tool below to find specific information within the annual report.-
 1
1 -
2
-
3
-
4
-
5
-
6
-
7
-
8
-
9
-
10
-
11
-
12
-
13
-
14
-
15
-
16
-
17
-
18
-
19
-
20
-
21
-
22
-
23
-
24
-
25
-
26
-
27
-
28
-
29
-
30
-
31
-
32
-
33
-
34
-
35
-
36
-
37
-
38
-
39
-
40
-
41
-
42
-
43
-
44
-
45
-
46
-
47
-
48
-
49
-
50
-
51
-
52
-
53
-
54
-
55
-
56
-
57
-
58
-
59
-
60
-
61
-
62
-
63
-
64
-
65
-
66
-
67
-
68
-
69
-
 70
70 -
 71
71 -
 72
72 -
 73
73 -
 74
74 -
 75
75 -
 76
76 -
 77
77 -
 78
78 -
 79
79 -
 80
80 -
 81
81 -
 82
82 -
 83
83 -
 84
84 -
 85
85 -
 86
86 -
 87
87 -
 88
88 -
 89
89 -
 90
90 -
91
-
92
-
93
-
94
-
95
-
96
-
97
-
98
-
99
-
100
-
101
-
102
-
103
-
104
-
105
-
106
-
107
-
108
-
109
-
110
-
111
-
112
-
113
-
114
-
115
-
116
-
117
-
118
-
119
-
120
-
121
-
122
-
123
-
124
-
125
-
126
-
127
-
128
-
129
-
130
-
131
-
132
-
133
-
134
-
135
-
136
-
137
-
138
-
139
-
140
-
141
-
142
-
143
-
144
-
145
-
146
-
147
-
148
-
149
-
150
-
151
-
152
-
153
-
154
-
155
-
156
-
157
-
158
-
159
-
160
-
161
-
162
-
163
-
164
-
165
-
166
-
167
-
168
-
169
-
170
-
171
-
172
-
173
-
174
 |
 |

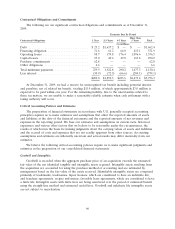
by 96; divided by (b) the sum of: (i) the Company’s EBITDA (as defined) for the preceding 12 months;
and (ii) annualized operating lease expense. Maximum ratios for this test were as follows:
Applebee’s Notes IHOP Notes
Through November 2008 ....................... 8.0x 7.75x
Through November 2009 ....................... 7.75x 7.5x
Thereafter .................................. 7.25x 7.0x
Failure to remain under these maximums could result in required early amortization of outstanding
principal amounts of the Applebee’s Notes or IHOP Notes. At December 31, 2009, the Company’s
consolidated leverage ratio was 5.71x. If the EBITDA component of the calculation had been
$95.4 million, or 22.8%, lower, the Company would have exceeded the maximum ratio allowed for the
IHOP Notes. The Company’s consolidated leverage ratio was 6.8x at December 31, 2008. The
consolidated leverage ratio has never fallen below a required maximum for either the Applebee’s Notes
or the IHOP Notes in any period since the Notes were issued.
As noted above, the denominator of the consolidated leverage ratio includes EBITDA for the
preceding 12 months. Our EBITDA has benefited from gains on debt extinguishment that will
ultimately drop out of the calculation once they fall out of the rolling 12-month calculation period. To
the extent gains on debt extinguishment do not continue to occur in amounts similar to those that have
been recognized in the past 12 months, our consolidated leverage ratio will be adversely impacted. The
consolidated leverage ratio calculated as of December 31, 2009, excluding all gains on extinguishment
of debt from the rolling 12-month calculation period, would have been 6.26x.
The formulas for calculating the debt service coverage ratios (‘‘DSCR’’) for each securitization are
fairly complex with numerous defined terms. In concept, DSCR is the ratio of restaurant net cash flow
(as defined) divided by total debt service payments, which include, among other things, interest
payments, insurance premiums and administrative expenses. The minimum DSCR for the preceding
three months is 1.85x. The consequences of falling below specified minimum three-month DSCRs vary
depending upon the actual ratio achieved. Three-month DSCRs below 1.85x can trigger a Cash
Trapping Event, a Rapid Amortization Event, or a Default Event, as outlined in the table below. In a
Cash Trapping Event, the indenture trustee for the affected securitization is required to retain a certain
percentage of cash flow (after all required payments have been made) in a restricted account. No
principal amounts of debt are retired in a Cash Trapping Event. In a Rapid Amortization Event, all
excess cash flow (after all required payments have been made) is retained and used to retire principal
amounts of debt. These events are triggered as follows:
Applebee’s Notes IHOP Notes
Cash Trapping Event .................. Less than 1.85x: Less than 1.85x:
25% of cash flow 40% of cash flow
Cash Trapping Event .................. Less than 1.75x: Less than 1.65x:
50% of cash flow 80% of cash flow
Rapid Amortization Event .............. Less than 1.5x Less than 1.5x
Default Event ....................... Less than 1.2x Less than 1.25x
There are also provisions for a one-time cure of either a Cash Trapping Event or a Rapid
Amortization Event if the DSCR recovers to certain levels for three consecutive payment dates. A
Rapid Amortization Event can also be triggered in other defined circumstances unrelated to the DSCR,
including Applebee’s failure to maintain a minimum level of system-wide sales. At December 31, 2009,
the Applebee’s three-month DSCR was 2.60x and the IHOP three-month DSCR was 3.31x. If the
restaurant cash flow components of the calculation had been $14.4 million, or 28.7%, and $10.0 million,
or 44.1%, lower for purposes of the Applebee’s and IHOP calculations, respectively, the Company
would have fallen below the 1.85x minimum threshold. At December 31, 2008, the Applebee’s
61