IHOP 2009 Annual Report Download - page 129
Download and view the complete annual report
Please find page 129 of the 2009 IHOP annual report below. You can navigate through the pages in the report by either clicking on the pages listed below, or by using the keyword search tool below to find specific information within the annual report.-
 1
1 -
2
-
3
-
4
-
5
-
6
-
7
-
8
-
9
-
10
-
11
-
12
-
13
-
14
-
15
-
16
-
17
-
18
-
19
-
20
-
21
-
22
-
23
-
24
-
25
-
26
-
27
-
28
-
29
-
30
-
31
-
32
-
33
-
34
-
35
-
36
-
37
-
38
-
39
-
40
-
41
-
42
-
43
-
44
-
45
-
46
-
47
-
48
-
49
-
50
-
51
-
52
-
53
-
54
-
55
-
56
-
57
-
58
-
59
-
60
-
61
-
62
-
63
-
64
-
65
-
66
-
67
-
68
-
69
-
70
-
71
-
72
-
73
-
74
-
75
-
76
-
77
-
78
-
79
-
80
-
81
-
82
-
83
-
84
-
85
-
86
-
87
-
88
-
89
-
90
-
91
-
92
-
93
-
94
-
95
-
96
-
97
-
98
-
99
-
100
-
101
-
102
-
103
-
104
-
105
-
106
-
107
-
108
-
109
-
110
-
111
-
112
-
113
-
114
-
115
-
116
-
117
-
118
-
 119
119 -
 120
120 -
 121
121 -
 122
122 -
 123
123 -
 124
124 -
 125
125 -
 126
126 -
 127
127 -
 128
128 -
 129
129 -
 130
130 -
 131
131 -
 132
132 -
 133
133 -
 134
134 -
 135
135 -
 136
136 -
 137
137 -
 138
138 -
 139
139 -
140
-
141
-
142
-
143
-
144
-
145
-
146
-
147
-
148
-
149
-
150
-
151
-
152
-
153
-
154
-
155
-
156
-
157
-
158
-
159
-
160
-
161
-
162
-
163
-
164
-
165
-
166
-
167
-
168
-
169
-
170
-
171
-
172
-
173
-
174
 |
 |
DineEquity, Inc. and Subsidiaries
Notes to the Consolidated Financial Statements (Continued)
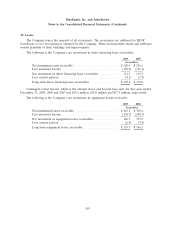
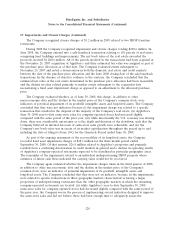
10. Leases (Continued)
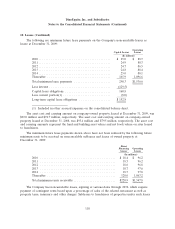
The following are minimum future lease payments on the Company’s noncancelable leases as
lessee at December 31, 2009:
Operating
Capital Leases Leases
(In millions)
2010 ......................................... $ 25.0 $ 88.7
2011 ......................................... 24.9 88.3
2012 ......................................... 24.7 86.5
2013 ......................................... 24.8 88.4
2014 ......................................... 25.0 88.1
Thereafter .................................... 165.9 1,096.6
Total minimum lease payments ..................... 290.3 $1,536.6
Less interest ................................... (129.5)
Capital lease obligations .......................... 160.8
Less current portion(1) ........................... (8.0)
Long-term capital lease obligations .................. $152.8
(1) Included in other accrued expenses on the consolidated balance sheet.
The asset cost and carrying amount on company-owned property leased at December 31, 2009, was
$92.0 million and $74.7 million, respectively. The asset cost and carrying amount on company-owned
property leased at December 31, 2008, was $95.4 million and $79.5 million, respectively. The asset cost
and carrying amounts represent the land and building asset values and net book values on sites leased
to franchisees.
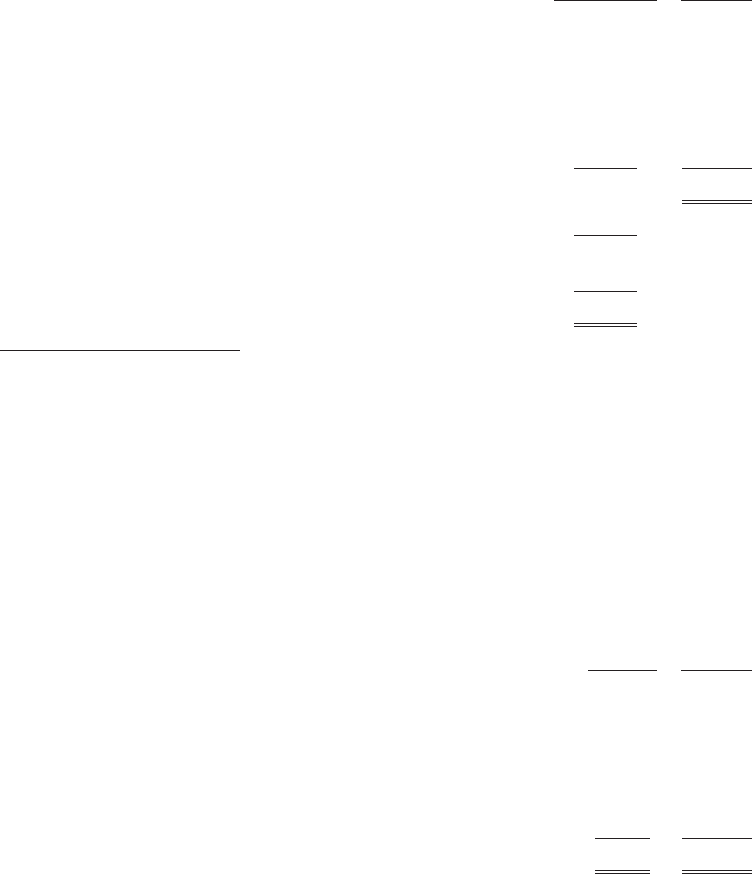
The minimum future lease payments shown above have not been reduced by the following future
minimum rents to be received on noncancelable subleases and leases of owned property at
December 31, 2009:
Direct
Financing Operating
Leases Leases
(In millions)
2010 ........................................... $ 18.4 $ 96.2
2011 ........................................... 18.5 96.2
2012 ........................................... 18.6 96.8
2013 ........................................... 18.7 97.6
2014 ........................................... 18.7 97.8
Thereafter ....................................... 128.0 1,063.2
Total minimum rents receivable ........................ $220.9 $1,547.8
The Company has noncancelable leases, expiring at various dates through 2032, which require
payment of contingent rents based upon a percentage of sales of the related restaurant as well as
property taxes, insurance and other charges. Subleases to franchisees of properties under such leases
110