IHOP 2009 Annual Report Download - page 78
Download and view the complete annual report
Please find page 78 of the 2009 IHOP annual report below. You can navigate through the pages in the report by either clicking on the pages listed below, or by using the keyword search tool below to find specific information within the annual report.-
 1
1 -
2
-
3
-
4
-
5
-
6
-
7
-
8
-
9
-
10
-
11
-
12
-
13
-
14
-
15
-
16
-
17
-
18
-
19
-
20
-
21
-
22
-
23
-
24
-
25
-
26
-
27
-
28
-
29
-
30
-
31
-
32
-
33
-
34
-
35
-
36
-
37
-
38
-
39
-
40
-
41
-
42
-
43
-
44
-
45
-
46
-
47
-
48
-
49
-
50
-
51
-
52
-
53
-
54
-
55
-
56
-
57
-
58
-
59
-
60
-
61
-
62
-
63
-
64
-
65
-
66
-
67
-
 68
68 -
 69
69 -
 70
70 -
 71
71 -
 72
72 -
 73
73 -
 74
74 -
 75
75 -
 76
76 -
 77
77 -
 78
78 -
 79
79 -
 80
80 -
 81
81 -
 82
82 -
 83
83 -
 84
84 -
 85
85 -
 86
86 -
 87
87 -
 88
88 -
89
-
90
-
91
-
92
-
93
-
94
-
95
-
96
-
97
-
98
-
99
-
100
-
101
-
102
-
103
-
104
-
105
-
106
-
107
-
108
-
109
-
110
-
111
-
112
-
113
-
114
-
115
-
116
-
117
-
118
-
119
-
120
-
121
-
122
-
123
-
124
-
125
-
126
-
127
-
128
-
129
-
130
-
131
-
132
-
133
-
134
-
135
-
136
-
137
-
138
-
139
-
140
-
141
-
142
-
143
-
144
-
145
-
146
-
147
-
148
-
149
-
150
-
151
-
152
-
153
-
154
-
155
-
156
-
157
-
158
-
159
-
160
-
161
-
162
-
163
-
164
-
165
-
166
-
167
-
168
-
169
-
170
-
171
-
172
-
173
-
174
 |
 |
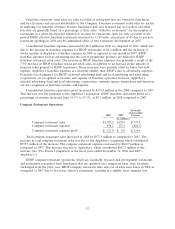
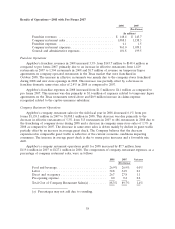
Total food and beverage costs as a percent of company restaurant sales were flat in 2008 as
compared to 2007. Food usage was impacted by increased commodity costs but offset by price increases
and food cost improvement initiatives.
Total labor costs as a percent of company restaurant sales decreased by 0.1% in 2008 as compared
to 2007. The decrease in 2008 was due primarily to reductions in hourly labor costs as a percentage of
sales due to an increased guest check offset by higher management incentive compensation driven by a
more costly bonus program in place during the first fiscal quarter of 2008.
Direct and occupancy costs decreased by 1.1% in 2008 as compared to 2007 due primarily to
favorable depreciation expense, which resulted from purchase price allocations related to Applebee’s
acquisition and the reclassification of restaurants into assets held for sale, partially offset by an increase
in rent expense and smallwares associated with purchase accounting and unfavorable utility expense.
Pre-opening expense decreased by 0.2% in 2008 as compared to 2007 due to opening one company
restaurant in early 2008 as compared to 14 in 2007. We do not currently plan to open any domestic
company-operated restaurants in the foreseeable future.
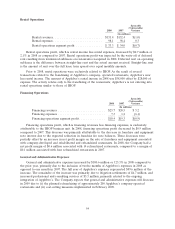
Rental Operations
As the result of several transactions related to the franchising of Applebee’s company-operated
restaurants, Applebee’s now has rental income. The amount of Applebee’s rental income in 2008 was
$58,000 offset by $28,000 in expenses. This activity relates only to the franchising of the restaurants;
Applebee’s is not entering into rental operations similar to those of IHOP.
General and Administrative Expenses
General and administrative expenses as a percentage of sales decreased from 15.3% in 2007 to
8.2% in 2008. The decrease was due primarily to the non-recurrence of stock-based compensation and
severance costs incurred in connection with the Applebee’s acquisition as well as non-recurrence of
costs related to the exploration of strategic alternatives for enhancing shareholder value.
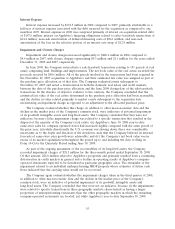
Liquidity and Capital Resources of the Company
The acquisition of Applebee’s in November 2007 had a significant impact on the liquidity and
capital resources of the Company. While the addition of Applebee’s increased our cash flow from
operations, a significant portion of the increase was consumed by interest payments on $2.3 billion of
indebtedness incurred to finance the acquisition. Cash paid for interest was $166.4 million in 2009 and
$194.8 million in 2008 as compared to $31.3 million in 2007. The amount of indebtedness also limits
our ability to obtain additional financing, due to both explicit limitations in the indenture under which
the indebtedness was issued and marketplace perception of our remaining debt capacity.
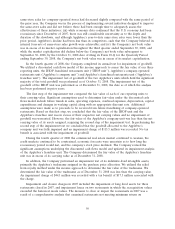
As described in Note 8 of the Notes to the Consolidated Financial Statements, the Fixed Rate
Notes (the ‘‘Notes’’) issued as part of the Applebee’s and IHOP November 2007 securitization
transactions have a legal maturity of December 2037; however, the indentures under which the Notes
were issued includes provisions which may require the early repayment, in whole or in part, of the
Notes which, if not met, would require the Company to use all or part of the excess cash flow that
would otherwise be available for general business purposes to fund a reserve account for the Notes or
to begin to pay down the Notes (see ‘‘Debt Covenant Compliance’’ below). As of December 31, 2009,
the conditions that would require an early repayment date for the Notes had not occurred.
Irrespective of covenant compliance, the accelerated payment date for the Applebee’s and IHOP
November 2007 securitization debt is December 2012, subject to extensions as discussed below.
In the event that we are unable to refinance the Applebee’s and IHOP November 2007
securitization debt by December 2012, we will have the ability to extend the scheduled payment date
59