IHOP 2009 Annual Report Download - page 151
Download and view the complete annual report
Please find page 151 of the 2009 IHOP annual report below. You can navigate through the pages in the report by either clicking on the pages listed below, or by using the keyword search tool below to find specific information within the annual report.-
 1
1 -
2
-
3
-
4
-
5
-
6
-
7
-
8
-
9
-
10
-
11
-
12
-
13
-
14
-
15
-
16
-
17
-
18
-
19
-
20
-
21
-
22
-
23
-
24
-
25
-
26
-
27
-
28
-
29
-
30
-
31
-
32
-
33
-
34
-
35
-
36
-
37
-
38
-
39
-
40
-
41
-
42
-
43
-
44
-
45
-
46
-
47
-
48
-
49
-
50
-
51
-
52
-
53
-
54
-
55
-
56
-
57
-
58
-
59
-
60
-
61
-
62
-
63
-
64
-
65
-
66
-
67
-
68
-
69
-
70
-
71
-
72
-
73
-
74
-
75
-
76
-
77
-
78
-
79
-
80
-
81
-
82
-
83
-
84
-
85
-
86
-
87
-
88
-
89
-
90
-
91
-
92
-
93
-
94
-
95
-
96
-
97
-
98
-
99
-
100
-
101
-
102
-
103
-
104
-
105
-
106
-
107
-
108
-
109
-
110
-
111
-
112
-
113
-
114
-
115
-
116
-
117
-
118
-
119
-
120
-
121
-
122
-
123
-
124
-
125
-
126
-
127
-
128
-
129
-
130
-
131
-
132
-
133
-
134
-
135
-
136
-
137
-
138
-
139
-
140
-
 141
141 -
 142
142 -
 143
143 -
 144
144 -
 145
145 -
 146
146 -
 147
147 -
 148
148 -
 149
149 -
 150
150 -
 151
151 -
 152
152 -
 153
153 -
 154
154 -
 155
155 -
 156
156 -
 157
157 -
 158
158 -
 159
159 -
 160
160 -
 161
161 -
162
-
163
-
164
-
165
-
166
-
167
-
168
-
169
-
170
-
171
-
172
-
173
-
174
 |
 |

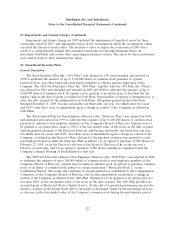
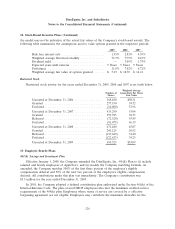
DineEquity, Inc. and Subsidiaries
Notes to the Consolidated Financial Statements (Continued)
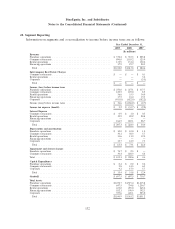
22. Segment Reporting
Information on segments and a reconciliation to income before income taxes are as follows:
Year Ended December 31,
2009 2008 2007
(In millions)
Revenues
Franchise operations .................................... $ 372.2 $ 353.3 $ 205.8
Company restaurants .................................... 890.0 1,103.2 125.9
Rental operations ...................................... 133.9 131.4 132.4
Financing operations .................................... 17.9 25.7 20.5
Total ............................................. $1,414.0 $1,613.6 $ 484.6
Intercompany Real Estate Charges
Company restaurants .................................... $ — $ — $ 0.1
Rental operations ...................................... — — 3.4
Corporate ........................................... — — (3.5)
Total ............................................. $ — $ — $ —
Income (loss) before income taxes
Franchise operations .................................... $ 270.0 $ 257.1 $ 117.7
Company restaurants .................................... 123.5 125.0 8.5
Rental operations ...................................... 36.6 33.3 34.0
Financing operations .................................... 17.5 18.4 19.3
Corporate ........................................... (411.0) (622.0) (182.2)
Income (loss) before income taxes ........................... $ 36.6 $ (188.2) $ (2.7)
Income tax expense (benefit) ............................... $ 5.2 $ (33.7) $ (2.2)
Interest Expense
Company restaurants .................................... $ 0.9 $ 1.0 $ 0.5
Rental operations ...................................... 19.9 20.2 20.8
Financing operations ....................................———
Corporate ........................................... 186.5 203.1 28.7
Total ............................................. $ 207.3 $ 224.3 $ 50.0
Depreciation and amortization
Franchise operations .................................... $ 10.0 $ 10.0 $ 1.0
Company restaurants .................................... 30.1 38.3 5.7
Rental operations ...................................... 11.6 11.9 12.0
Financing operations ....................................———
Corporate ........................................... 13.7 12.9 7.3
Total ............................................. $ 65.4 $ 73.1 $ 26.0
Impairment and closure charges
Franchise operations .................................... $ 74.7 $ 2.3 $ —
Company restaurants .................................... 30.4 238.3 4.4
Total .............................................. $ 105.1 $ 240.6 $ 4.4
Capital Expenditures
Franchise operations .................................... $ 0.4 $ 0.2 $ 0.4
Company restaurants .................................... 5.8 14.3 6.3
Corporate ........................................... 9.2 17.3 5.7
Total ............................................. $ 15.4 $ 31.8 $ 12.4
Goodwill ............................................ $ 697.5 $ 697.5 $ 730.7
Total Assets
Franchise operations .................................... $1,478.7 $1,519.4 $1,415.8
Company restaurants .................................... 647.5 734.8 1,234.7
Rental operations ...................................... 433.0 459.0 465.4
Financing operations .................................... 182.1 198.9 192.3
Corporate ........................................... 359.6 449.1 523.0
Total ............................................. $3,100.9 $3,361.2 $3,831.2
132