IHOP 2009 Annual Report Download - page 51
Download and view the complete annual report
Please find page 51 of the 2009 IHOP annual report below. You can navigate through the pages in the report by either clicking on the pages listed below, or by using the keyword search tool below to find specific information within the annual report.-
 1
1 -
2
-
3
-
4
-
5
-
6
-
7
-
8
-
9
-
10
-
11
-
12
-
13
-
14
-
15
-
16
-
17
-
18
-
19
-
20
-
21
-
22
-
23
-
24
-
25
-
26
-
27
-
28
-
29
-
30
-
31
-
32
-
33
-
34
-
35
-
36
-
37
-
38
-
39
-
40
-
 41
41 -
 42
42 -
 43
43 -
 44
44 -
 45
45 -
 46
46 -
 47
47 -
 48
48 -
 49
49 -
 50
50 -
 51
51 -
 52
52 -
 53
53 -
 54
54 -
 55
55 -
 56
56 -
 57
57 -
 58
58 -
 59
59 -
 60
60 -
 61
61 -
62
-
63
-
64
-
65
-
66
-
67
-
68
-
69
-
70
-
71
-
72
-
73
-
74
-
75
-
76
-
77
-
78
-
79
-
80
-
81
-
82
-
83
-
84
-
85
-
86
-
87
-
88
-
89
-
90
-
91
-
92
-
93
-
94
-
95
-
96
-
97
-
98
-
99
-
100
-
101
-
102
-
103
-
104
-
105
-
106
-
107
-
108
-
109
-
110
-
111
-
112
-
113
-
114
-
115
-
116
-
117
-
118
-
119
-
120
-
121
-
122
-
123
-
124
-
125
-
126
-
127
-
128
-
129
-
130
-
131
-
132
-
133
-
134
-
135
-
136
-
137
-
138
-
139
-
140
-
141
-
142
-
143
-
144
-
145
-
146
-
147
-
148
-
149
-
150
-
151
-
152
-
153
-
154
-
155
-
156
-
157
-
158
-
159
-
160
-
161
-
162
-
163
-
164
-
165
-
166
-
167
-
168
-
169
-
170
-
171
-
172
-
173
-
174
 |
 |

2MAR201003392204
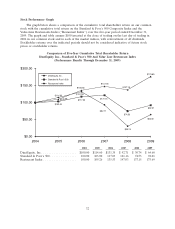
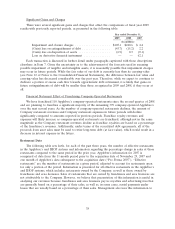
Stock Performance Graph
The graph below shows a comparison of the cumulative total shareholder return on our common
stock with the cumulative total return on the Standard & Poor’s 500 Composite Index and the
Value-Line Restaurants Index (‘‘Restaurant Index’’) over the five-year period ended December 31,
2009. The graph and table assume $100 invested at the close of trading on the last day of trading in
2004 in our common stock and in each of the market indices, with reinvestment of all dividends.
Stockholder returns over the indicated periods should not be considered indicative of future stock
prices or stockholder returns.
Comparison of Five-Year Cumulative Total Shareholder Return
DineEquity, Inc., Standard & Poor’s 500 And Value Line Restaurant Index
(Performance Results Through December 31, 2009)
$200.00
Standard & Poor’s 500
Restaurant Index
$150.00
$100.00
$50.00
2004 2005 2006 2007 2008 2009
$0.00
DineEquity, Inc.
$114.60
$135.53
$92.71
$30.74
$64.60
$103.00
$117.03 $121.16
$74.53
$92.01
$109.26
$131.35
$147.03
$137.15
$175.69
2004 2005 2006 2007 2008 2009
DineEquity, Inc. ................... $100.00 $114.60 $131.35 $ 92.71 $ 30.74 $ 64.60
Standard & Poor’s 500 ............... 100.00 103.00 117.03 121.16 74.53 92.01
Restaurant Index ................... 100.00 109.26 135.53 147.03 137.15 175.69
32