IHOP 2009 Annual Report Download - page 72
Download and view the complete annual report
Please find page 72 of the 2009 IHOP annual report below. You can navigate through the pages in the report by either clicking on the pages listed below, or by using the keyword search tool below to find specific information within the annual report.-
 1
1 -
2
-
3
-
4
-
5
-
6
-
7
-
8
-
9
-
10
-
11
-
12
-
13
-
14
-
15
-
16
-
17
-
18
-
19
-
20
-
21
-
22
-
23
-
24
-
25
-
26
-
27
-
28
-
29
-
30
-
31
-
32
-
33
-
34
-
35
-
36
-
37
-
38
-
39
-
40
-
41
-
42
-
43
-
44
-
45
-
46
-
47
-
48
-
49
-
50
-
51
-
52
-
53
-
54
-
55
-
56
-
57
-
58
-
59
-
60
-
61
-
 62
62 -
 63
63 -
 64
64 -
 65
65 -
 66
66 -
 67
67 -
 68
68 -
 69
69 -
 70
70 -
 71
71 -
 72
72 -
 73
73 -
 74
74 -
 75
75 -
 76
76 -
 77
77 -
 78
78 -
 79
79 -
 80
80 -
 81
81 -
 82
82 -
83
-
84
-
85
-
86
-
87
-
88
-
89
-
90
-
91
-
92
-
93
-
94
-
95
-
96
-
97
-
98
-
99
-
100
-
101
-
102
-
103
-
104
-
105
-
106
-
107
-
108
-
109
-
110
-
111
-
112
-
113
-
114
-
115
-
116
-
117
-
118
-
119
-
120
-
121
-
122
-
123
-
124
-
125
-
126
-
127
-
128
-
129
-
130
-
131
-
132
-
133
-
134
-
135
-
136
-
137
-
138
-
139
-
140
-
141
-
142
-
143
-
144
-
145
-
146
-
147
-
148
-
149
-
150
-
151
-
152
-
153
-
154
-
155
-
156
-
157
-
158
-
159
-
160
-
161
-
162
-
163
-
164
-
165
-
166
-
167
-
168
-
169
-
170
-
171
-
172
-
173
-
174
 |
 |

Franchise restaurant retail sales are sales recorded at restaurants that are owned by franchisees
and area licensees and are not attributable to the Company. Franchise restaurant retail sales are useful
in analyzing our franchise revenues because franchisees and area licensees pay us royalties and other
fees that are generally based on a percentage of their sales. ‘‘Effective restaurants’’ are the number of
restaurants in a given fiscal period adjusted to account for restaurants open for only a portion of the
period. IHOP effective franchise restaurants increased to 1,189 units, an increase of 45 due to net new
restaurant openings in 2008 and the annualized effect of new restaurant development in 2007.
Consolidated franchise expenses increased by $8.2 million in 2008 as compared to 2007, which was
due to the increase in franchise expenses for IHOP restaurants of $4.2 million and the inclusion of
twelve months of Applebee’s franchise expenses in 2008 as opposed to one month in 2007. IHOP
franchise expenses such as advertising and the cost of proprietary products are related to IHOP
franchise restaurant retail sales. The increase in IHOP franchise expenses was primarily a result of the
5.9% increase in IHOP franchise restaurant retail sales, in addition to an increase in the amount of
financial relief granted to IHOP franchisees. These increases were partially offset by lower bad debt
expense. Applebee’s franchise expenses are relatively smaller than IHOP’s due to advertising expenses.
Franchise fees designated for IHOP’s national advertising fund and local marketing and advertising
cooperatives are recognized as revenue and expense of franchise operation; however, Applebee’s
national advertising fund and local advertising cooperatives constitute agency transactions and therefore
are not recognized as franchise revenue and expense.
Consolidated franchise operations profit increased by $139.4 million in the 2008 compared to 2007.
This increase was due primarily to the Applebee’s acquisition. IHOP franchise operations profit as a
percentage of revenue increased from 54.1% to 55.1%, or $9.1 million, in 2008 compared to 2007.
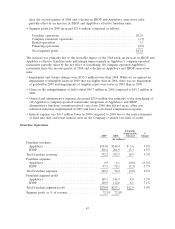
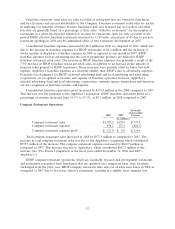
Company Restaurant Operations
Favorable
(Unfavorable)
2008 2007 Variance
(In millions)
Company restaurant sales ................... $1,103.2 $125.9 $ 977.3
Company restaurant expenses ................ 978.2 117.5 (860.7)
Company restaurant segment profit ............ $ 125.0 $ 8.4 $ 116.6
Total company restaurant sales increased in 2008 by $977.3 million as compared to 2007. The
increase in total company restaurant sales was due to the Applebee’s acquisition which contributed
$979.3 million of the increase. The company restaurant expenses increased by $860.7 million as
compared to 2007. This increase was due to Applebee’s, which contributed $863.2 million of the
increase (see ‘‘Pro Forma Comparison of the fiscal years ended December 31, 2008 and 2007—
Applebee’s’’).
IHOP company restaurant operations, which are essentially research and development restaurants
and restaurants reacquired from franchisees that are operated on a temporary basis, were relatively
unchanged from the prior year. IHOP company restaurant sales and cost of sales were lower in 2008 as
compared to 2007 due to two fewer effective restaurants, resulting in a slightly lower segment loss.
53