IHOP 2009 Annual Report Download - page 61
Download and view the complete annual report
Please find page 61 of the 2009 IHOP annual report below. You can navigate through the pages in the report by either clicking on the pages listed below, or by using the keyword search tool below to find specific information within the annual report.-
 1
1 -
2
-
3
-
4
-
5
-
6
-
7
-
8
-
9
-
10
-
11
-
12
-
13
-
14
-
15
-
16
-
17
-
18
-
19
-
20
-
21
-
22
-
23
-
24
-
25
-
26
-
27
-
28
-
29
-
30
-
31
-
32
-
33
-
34
-
35
-
36
-
37
-
38
-
39
-
40
-
41
-
42
-
43
-
44
-
45
-
46
-
47
-
48
-
49
-
50
-
 51
51 -
 52
52 -
 53
53 -
 54
54 -
 55
55 -
 56
56 -
 57
57 -
 58
58 -
 59
59 -
 60
60 -
 61
61 -
 62
62 -
 63
63 -
 64
64 -
 65
65 -
 66
66 -
 67
67 -
 68
68 -
 69
69 -
 70
70 -
 71
71 -
72
-
73
-
74
-
75
-
76
-
77
-
78
-
79
-
80
-
81
-
82
-
83
-
84
-
85
-
86
-
87
-
88
-
89
-
90
-
91
-
92
-
93
-
94
-
95
-
96
-
97
-
98
-
99
-
100
-
101
-
102
-
103
-
104
-
105
-
106
-
107
-
108
-
109
-
110
-
111
-
112
-
113
-
114
-
115
-
116
-
117
-
118
-
119
-
120
-
121
-
122
-
123
-
124
-
125
-
126
-
127
-
128
-
129
-
130
-
131
-
132
-
133
-
134
-
135
-
136
-
137
-
138
-
139
-
140
-
141
-
142
-
143
-
144
-
145
-
146
-
147
-
148
-
149
-
150
-
151
-
152
-
153
-
154
-
155
-
156
-
157
-
158
-
159
-
160
-
161
-
162
-
163
-
164
-
165
-
166
-
167
-
168
-
169
-
170
-
171
-
172
-
173
-
174
 |
 |

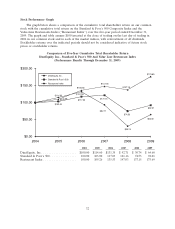
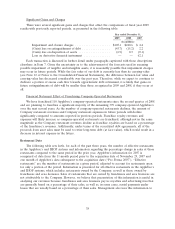
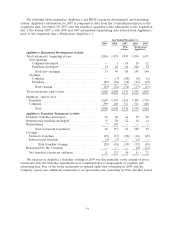
for the increase was that six of the restaurants closed in 2009 were originally planned to be closed in
2008.
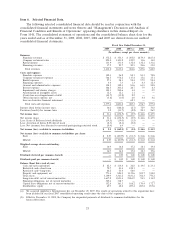
Year Ended December 31,
2009 2008 2007 2006 2005
IHOP Restaurant Development Activity
Total restaurants, beginning of year ............... 1,396 1,344 1,302 1,242 1,186
New openings
Company-developed ...................... 1 1 — 4 4
Franchise-developed ...................... 69 65 59 57 58
Area license ............................65185
Total new openings ..................... 76 71 60 69 67
Closings
Company .............................. — (1) (2) — (1)
Franchise .............................. (14) (16) (12) (8) (10)
Area license ............................ (2) (2) (4) (1) —
Total closings .......................... (16) (19) (18) (9) (11)
Total restaurants, end of year ................... 1,456 1,396 1,344 1,302 1,242
Summary—end of year
Franchise ................................ 1,279 1,225 1,176 1,132 1,082
Company ................................ 13 11 11 10 7
Area license .............................. 164 160 157 160 153
Total ................................ 1,456 1,396 1,344 1,302 1,242
IHOP Franchise Restaurant Activity
Company-developed ..........................———— 3
Domestic franchise-developed ................... 62 62 57 57 58
International franchise-developed ................732——
Rehabilitated and refranchised .................. 2 13 4 9 26
Total restaurants franchised ............... 71 78 63 66 87
Closings
Domestic franchise ......................... (14) (15) (12) (8) (10)
International franchise ...................... — (1) — — —
Total franchise closings ................... (14) (16) (12) (8) (10)
Reacquired by the Company .................... (3) (13) (7) (8) (23)
Net franchise restaurant additions .............. 54 49 44 50 54
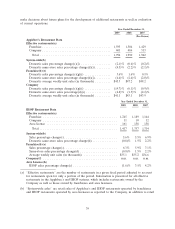
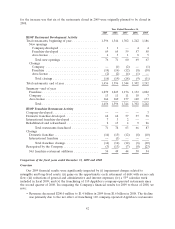
Comparison of the fiscal years ended December 31, 2009 and 2008
Overview
Our 2009 financial results were significantly impacted by (i) impairment charges related to
intangible and long-lived assets; (ii) gains on the opportunistic early retirement of debt with excess cash
flow; (iii) reductions of general and administrative and interest expenses; (iv) a 53rd calendar week
included in fiscal 2009; and (v) the franchising of 110 Applebee’s company-operated restaurants since
the second quarter of 2008. In comparing the Company’s financial results for 2009 to those of 2008, we
note:
• Revenues decreased $200.0 million to $1.4 billion in 2009 from $1.6 billion in 2008. The decline
was primarily due to the net effect of franchising 110 company-operated Applebee’s restaurants
42