IHOP 2009 Annual Report Download - page 77
Download and view the complete annual report
Please find page 77 of the 2009 IHOP annual report below. You can navigate through the pages in the report by either clicking on the pages listed below, or by using the keyword search tool below to find specific information within the annual report.-
 1
1 -
2
-
3
-
4
-
5
-
6
-
7
-
8
-
9
-
10
-
11
-
12
-
13
-
14
-
15
-
16
-
17
-
18
-
19
-
20
-
21
-
22
-
23
-
24
-
25
-
26
-
27
-
28
-
29
-
30
-
31
-
32
-
33
-
34
-
35
-
36
-
37
-
38
-
39
-
40
-
41
-
42
-
43
-
44
-
45
-
46
-
47
-
48
-
49
-
50
-
51
-
52
-
53
-
54
-
55
-
56
-
57
-
58
-
59
-
60
-
61
-
62
-
63
-
64
-
65
-
66
-
 67
67 -
 68
68 -
 69
69 -
 70
70 -
 71
71 -
 72
72 -
 73
73 -
 74
74 -
 75
75 -
 76
76 -
 77
77 -
 78
78 -
 79
79 -
 80
80 -
 81
81 -
 82
82 -
 83
83 -
 84
84 -
 85
85 -
 86
86 -
 87
87 -
88
-
89
-
90
-
91
-
92
-
93
-
94
-
95
-
96
-
97
-
98
-
99
-
100
-
101
-
102
-
103
-
104
-
105
-
106
-
107
-
108
-
109
-
110
-
111
-
112
-
113
-
114
-
115
-
116
-
117
-
118
-
119
-
120
-
121
-
122
-
123
-
124
-
125
-
126
-
127
-
128
-
129
-
130
-
131
-
132
-
133
-
134
-
135
-
136
-
137
-
138
-
139
-
140
-
141
-
142
-
143
-
144
-
145
-
146
-
147
-
148
-
149
-
150
-
151
-
152
-
153
-
154
-
155
-
156
-
157
-
158
-
159
-
160
-
161
-
162
-
163
-
164
-
165
-
166
-
167
-
168
-
169
-
170
-
171
-
172
-
173
-
174
 |
 |

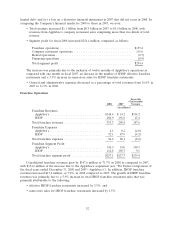
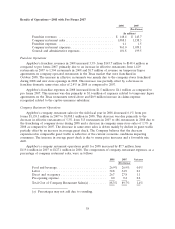
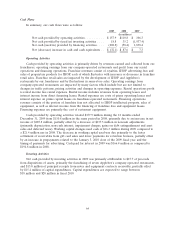
Results of Operations—2008 with Pro Forma 2007
2008 2007
(Pro Forma)
(In millions)
Franchise revenues ............................... $ 148.4 $ 143.7
Company restaurant sales ........................... 1,088.1 1,158.5
Franchise expenses ............................... 4.1 1.5
Company restaurant expenses ........................ 961.0 1,039.1
General and administrative expenses ................... 101.8 199.5
Franchise Operations
Applebee’s franchise revenues in 2008 increased 3.3% from $143.7 million to $148.4 million as
compared to pro forma 2007, primarily due to an increase in effective restaurants from 1,429
restaurants in 2007 to 1,504 restaurants in 2008 and $1.7 million of revenue on temporary liquor
agreements on company-operated restaurants in the Texas market that were franchised in
October 2008. The increase in effective restaurants was mainly due to the company stores franchised
during 2008 and new store openings in 2008. This increase was partially offset by a decrease in
franchise domestic same-store sales of 2.4% in 2008 as compared to 2007.
Applebee’s franchise expenses in 2008 increased from $1.5 million to $4.1 million as compared to
pro forma 2007. This increase was due primarily to $1.6 million of expenses related to temporary liquor
agreements on the Texas restaurants noted above and $0.9 million increase in claims expense
recognized related to the captive insurance subsidiary.
Company Restaurant Operations
Applebee’s company restaurant sales for the full fiscal year in 2008 decreased 6.1% from pro
forma $1,158.5 million in 2007 to $1,088.1 million in 2008. This decrease was due primarily to the
decrease in effective restaurants of 5.3% from 513 restaurants in 2007 to 486 restaurants in 2008 due to
the franchising of company stores during 2008 and a decrease in company same-store sales of 1.3% in
2008 as compared to 2007. The decrease in same-store sales is driven mainly by decline in guest traffic
partially offset by an increase in average guest check. The Company believes that the decrease
experienced in comparable guest traffic is reflective of the current economic conditions impacting
consumers. The increase in average guest check is due to menu price increases and a favorable mix
shift.
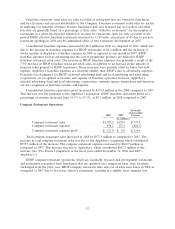
Applebee’s company restaurant operations profit for 2008 increased by $7.7 million from
$119.4 million in 2007 to $127.1 million in 2008. The components of company restaurant expenses, as a
percentage of company restaurant sales, were as follows:
2008 2007 Variance
(Pro forma)
Food and beverage ............................ 26.9% 26.9% 0.0%
Labor ..................................... 34.8 34.9 0.1
Direct and occupancy .......................... 26.7 27.8 1.1
Pre-opening expense ........................... 0.0 0.2 0.2
Total Cost of Company Restaurant Sales(a) .......... 88.3% 89.7% 1.4%
(a) Percentages may not add due to rounding.
58