IHOP 2009 Annual Report Download - page 150
Download and view the complete annual report
Please find page 150 of the 2009 IHOP annual report below. You can navigate through the pages in the report by either clicking on the pages listed below, or by using the keyword search tool below to find specific information within the annual report.-
 1
1 -
2
-
3
-
4
-
5
-
6
-
7
-
8
-
9
-
10
-
11
-
12
-
13
-
14
-
15
-
16
-
17
-
18
-
19
-
20
-
21
-
22
-
23
-
24
-
25
-
26
-
27
-
28
-
29
-
30
-
31
-
32
-
33
-
34
-
35
-
36
-
37
-
38
-
39
-
40
-
41
-
42
-
43
-
44
-
45
-
46
-
47
-
48
-
49
-
50
-
51
-
52
-
53
-
54
-
55
-
56
-
57
-
58
-
59
-
60
-
61
-
62
-
63
-
64
-
65
-
66
-
67
-
68
-
69
-
70
-
71
-
72
-
73
-
74
-
75
-
76
-
77
-
78
-
79
-
80
-
81
-
82
-
83
-
84
-
85
-
86
-
87
-
88
-
89
-
90
-
91
-
92
-
93
-
94
-
95
-
96
-
97
-
98
-
99
-
100
-
101
-
102
-
103
-
104
-
105
-
106
-
107
-
108
-
109
-
110
-
111
-
112
-
113
-
114
-
115
-
116
-
117
-
118
-
119
-
120
-
121
-
122
-
123
-
124
-
125
-
126
-
127
-
128
-
129
-
130
-
131
-
132
-
133
-
134
-
135
-
136
-
137
-
138
-
139
-
 140
140 -
 141
141 -
 142
142 -
 143
143 -
 144
144 -
 145
145 -
 146
146 -
 147
147 -
 148
148 -
 149
149 -
 150
150 -
 151
151 -
 152
152 -
 153
153 -
 154
154 -
 155
155 -
 156
156 -
 157
157 -
 158
158 -
 159
159 -
 160
160 -
161
-
162
-
163
-
164
-
165
-
166
-
167
-
168
-
169
-
170
-
171
-
172
-
173
-
174
 |
 |

DineEquity, Inc. and Subsidiaries
Notes to the Consolidated Financial Statements (Continued)
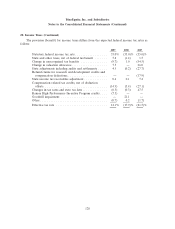
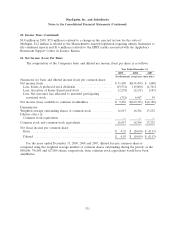
20. Income Taxes (Continued)
$9.8 million in 2009, $7.0 million is related to a change in the enacted tax law for the state of
Michigan, $1.2 million is related to the Massachusetts enacted legislation requiring unitary businesses to
file combined reports and $1.6 million is related to the HPIP credits associated with the Applebee’s
Restaurant Support Center in Lenexa, Kansas.
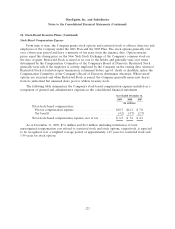
21. Net Income (Loss) Per Share
The computation of the Company’s basic and diluted net income (loss) per share is as follows:
Year Ended December 31,
2009 2008 2007
(In thousands, except per share data)
Numerator for basic and diluted income (loss) per common share:
Net income (loss) ....................................... $31,409 $(154,459) $ (480)
Less: Series A preferred stock dividends .................... (19,531) (19,000) (1,561)
Less: Accretion of Series B preferred stock .................. (2,291) (2,151) (181)
Less: Net (income) loss allocated to unvested participating
restricted stock ..................................... (351) 6,417 34
Net income (loss) available to common stockholders ............. $ 9,236 $(169,193) $ (2,188)
Denominator:
Weighted average outstanding shares of common stock ........... 16,917 16,764 17,232
Dilutive effect of:
Common stock equivalents .............................. — — —
Common stock and common stock equivalents .................. 16,917 16,764 17,232
Net (loss) income per common share:
Basic .............................................. $ 0.55 $ (10.09) $ (0.13)
Diluted ............................................ $ 0.55 $ (10.09) $ (0.13)
For the years ended December 31, 2009, 2008 and 2007, diluted loss per common share is
computed using the weighted average number of common shares outstanding during the period, as the
848,000, 756,000 and 627,000 shares, respectively, from common stock equivalents would have been
antidilutive.
131