IHOP 2009 Annual Report Download - page 62
Download and view the complete annual report
Please find page 62 of the 2009 IHOP annual report below. You can navigate through the pages in the report by either clicking on the pages listed below, or by using the keyword search tool below to find specific information within the annual report.-
 1
1 -
2
-
3
-
4
-
5
-
6
-
7
-
8
-
9
-
10
-
11
-
12
-
13
-
14
-
15
-
16
-
17
-
18
-
19
-
20
-
21
-
22
-
23
-
24
-
25
-
26
-
27
-
28
-
29
-
30
-
31
-
32
-
33
-
34
-
35
-
36
-
37
-
38
-
39
-
40
-
41
-
42
-
43
-
44
-
45
-
46
-
47
-
48
-
49
-
50
-
51
-
 52
52 -
 53
53 -
 54
54 -
 55
55 -
 56
56 -
 57
57 -
 58
58 -
 59
59 -
 60
60 -
 61
61 -
 62
62 -
 63
63 -
 64
64 -
 65
65 -
 66
66 -
 67
67 -
 68
68 -
 69
69 -
 70
70 -
 71
71 -
 72
72 -
73
-
74
-
75
-
76
-
77
-
78
-
79
-
80
-
81
-
82
-
83
-
84
-
85
-
86
-
87
-
88
-
89
-
90
-
91
-
92
-
93
-
94
-
95
-
96
-
97
-
98
-
99
-
100
-
101
-
102
-
103
-
104
-
105
-
106
-
107
-
108
-
109
-
110
-
111
-
112
-
113
-
114
-
115
-
116
-
117
-
118
-
119
-
120
-
121
-
122
-
123
-
124
-
125
-
126
-
127
-
128
-
129
-
130
-
131
-
132
-
133
-
134
-
135
-
136
-
137
-
138
-
139
-
140
-
141
-
142
-
143
-
144
-
145
-
146
-
147
-
148
-
149
-
150
-
151
-
152
-
153
-
154
-
155
-
156
-
157
-
158
-
159
-
160
-
161
-
162
-
163
-
164
-
165
-
166
-
167
-
168
-
169
-
170
-
171
-
172
-
173
-
174
 |
 |

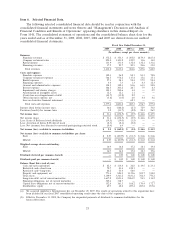
since the second quarter of 2008 and a decline in IHOP and Applebee’s same-store sales,
partially offset by an increase in IHOP and Applebee’s effective franchise units.
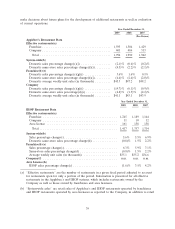
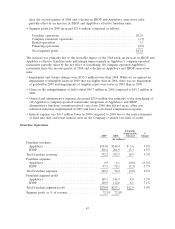
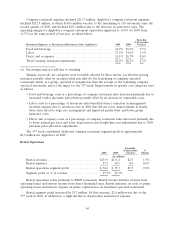
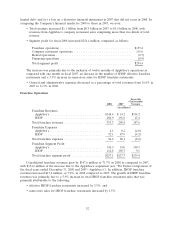
• Segment profit for 2009 increased $13.8 million, comprised as follows:
Franchise operations .......................................... $12.9
Company restaurant operations .................................. (1.5)
Rental operations ............................................ 3.3
Financing operations .......................................... (0.9)
Total segment profit .......................................... $13.8
The increase was primarily due to the favorable impact of the 53rd week, an increase in IHOP and
Applebee’s effective franchise units and margin improvements in Applebee’s company-operated
restaurants partially offset by the net effect of franchising 110 company-operated Applebee’s
restaurants since the second quarter of 2008 and a decline in Applebee’s and IHOP same-store
sales.
• Impairment and closure charges were $135.5 million lower than 2008. While we recognized an
impairment of intangible assets in 2009 that was higher than in 2008, there was no impairment
of goodwill in 2009 and impairments of tangible assets were lower in 2009 than in 2008.
• Gains on the extinguishment of debt totaled $45.7 million in 2009 compared to $15.2 million in
2008.
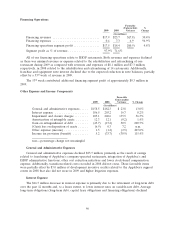
• General and administrative expenses decreased $23.8 million due primarily to the franchising of
110 Applebee’s company-operated restaurants, integration of Applebee’s and IHOP
administrative functions, transition-related costs from 2008 that did not recur, other cost
reduction initiatives implemented in 2009 and lower stock-based compensation expense.
• Interest expense was $16.7 million lower in 2009 compared to 2008 due to the early retirement
of fixed rate debt and lower interest rates on the Company’s variable rate lines of credit.
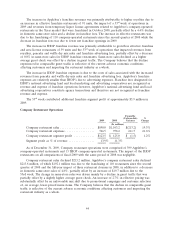
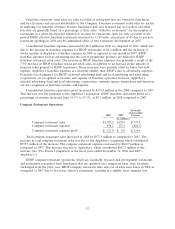
Franchise Operations
Favorable
(Unfavorable) %
2009 2008 Variance Change
(In millions)
Franchise revenues
Applebee’s .............................. $154.0 $148.4 $ 5.6 3.8%
IHOP ................................. 218.2 204.9 13.3 6.5%
Total franchise revenues ...................... 372.2 353.3 18.9 5.3%
Franchise expenses
Applebee’s .............................. 4.9 4.1 (0.8) 19.2%
IHOP ................................. 97.3 92.1 (5.2) 5.7%
Total franchise expenses ...................... 102.2 96.2 (6.0) 6.2%
Franchise segment profit
Applebee’s .............................. 149.1 144.3 4.8 3.3%
IHOP ................................. 120.9 112.8 8.1 7.1%
Total franchise segment profit .................. $270.0 $257.1 $12.9 5.0%
Segment profit as % of revenue ................ 72.5% 72.8%
43