IHOP 2009 Annual Report Download - page 60
Download and view the complete annual report
Please find page 60 of the 2009 IHOP annual report below. You can navigate through the pages in the report by either clicking on the pages listed below, or by using the keyword search tool below to find specific information within the annual report.-
 1
1 -
2
-
3
-
4
-
5
-
6
-
7
-
8
-
9
-
10
-
11
-
12
-
13
-
14
-
15
-
16
-
17
-
18
-
19
-
20
-
21
-
22
-
23
-
24
-
25
-
26
-
27
-
28
-
29
-
30
-
31
-
32
-
33
-
34
-
35
-
36
-
37
-
38
-
39
-
40
-
41
-
42
-
43
-
44
-
45
-
46
-
47
-
48
-
49
-
 50
50 -
 51
51 -
 52
52 -
 53
53 -
 54
54 -
 55
55 -
 56
56 -
 57
57 -
 58
58 -
 59
59 -
 60
60 -
 61
61 -
 62
62 -
 63
63 -
 64
64 -
 65
65 -
 66
66 -
 67
67 -
 68
68 -
 69
69 -
 70
70 -
71
-
72
-
73
-
74
-
75
-
76
-
77
-
78
-
79
-
80
-
81
-
82
-
83
-
84
-
85
-
86
-
87
-
88
-
89
-
90
-
91
-
92
-
93
-
94
-
95
-
96
-
97
-
98
-
99
-
100
-
101
-
102
-
103
-
104
-
105
-
106
-
107
-
108
-
109
-
110
-
111
-
112
-
113
-
114
-
115
-
116
-
117
-
118
-
119
-
120
-
121
-
122
-
123
-
124
-
125
-
126
-
127
-
128
-
129
-
130
-
131
-
132
-
133
-
134
-
135
-
136
-
137
-
138
-
139
-
140
-
141
-
142
-
143
-
144
-
145
-
146
-
147
-
148
-
149
-
150
-
151
-
152
-
153
-
154
-
155
-
156
-
157
-
158
-
159
-
160
-
161
-
162
-
163
-
164
-
165
-
166
-
167
-
168
-
169
-
170
-
171
-
172
-
173
-
174
 |
 |

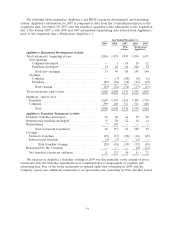
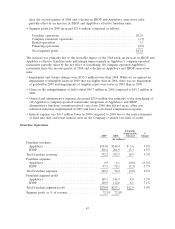
The following tables summarize Applebee’s and IHOP restaurant development and franchising
activity. Applebee’s information for 2007 is comprised of data from the 11-month period prior to the
acquisition date, November 29, 2007, and one month of Applebee’s data subsequent to the acquisition
date (‘‘Pro Forma 2007’’), with 2006 and 2005 information representing data derived from Applebee’s
prior to the acquisition date (‘‘Predecessor Applebee’s’’).
Year Ended December 31,
2009 2008 2007 2006 2005
(Pro (Predecessor
forma) Applebee’s)
Applebee’s Restaurant Development Activity
Total restaurants, beginning of year .............. 2,004 1,976 1,930 1,804 1,671
New openings
Company-developed ...................... — 1 14 35 52
Franchise-developed ...................... 33 48 66 108 92
Total new openings ..................... 33 49 80 143 144
Closings
Company .............................. — (3) (24) (4) (1)
Franchise .............................. (29) (18) (10) (13) (10)
Total closings ......................... (29) (21) (34) (17) (11)
Total restaurants, end of year ................... 2,008 2,004 1,976 1,930 1,804
Summary—end of year
Franchise ................................ 1,609 1,598 1,465 1,409 1,318
Company ................................ 399 406 511 521 486
Total ................................ 2,008 2,004 1,976 1,930 1,804
Applebee’s Franchise Restaurant Activity
Domestic franchise-developed .................. 18 28 44 90 78
International franchise-developed ................ 15 20 22 18 14
Refranchised ............................... 7 103 — — —
Total restaurant franchised ................ 40 151 66 108 92
Closings
Domestic franchise ......................... (25) (15) (10) (12) (10)
International franchise ...................... (4) (3) — (1) —
Total franchise closings ................. (29) (18) (10) (13) (10)
Reacquired by the Company ................... — — — (4) (11)
Net franchise restaurant additions .............. 11 133 56 91 71
The increase in Applebee’s franchise closings in 2009 was due primarily to the closing of seven
restaurants after the franchise agreements were terminated due to nonpayment of royalties and
advertising fees. One of the seven restaurants re-opened under new ownership in 2009, and the
Company expects two additional restaurants to re-open under new ownership in 2010. Another reason
41