IHOP 2009 Annual Report Download - page 96
Download and view the complete annual report
Please find page 96 of the 2009 IHOP annual report below. You can navigate through the pages in the report by either clicking on the pages listed below, or by using the keyword search tool below to find specific information within the annual report.-
 1
1 -
2
-
3
-
4
-
5
-
6
-
7
-
8
-
9
-
10
-
11
-
12
-
13
-
14
-
15
-
16
-
17
-
18
-
19
-
20
-
21
-
22
-
23
-
24
-
25
-
26
-
27
-
28
-
29
-
30
-
31
-
32
-
33
-
34
-
35
-
36
-
37
-
38
-
39
-
40
-
41
-
42
-
43
-
44
-
45
-
46
-
47
-
48
-
49
-
50
-
51
-
52
-
53
-
54
-
55
-
56
-
57
-
58
-
59
-
60
-
61
-
62
-
63
-
64
-
65
-
66
-
67
-
68
-
69
-
70
-
71
-
72
-
73
-
74
-
75
-
76
-
77
-
78
-
79
-
80
-
81
-
82
-
83
-
84
-
85
-
 86
86 -
 87
87 -
 88
88 -
 89
89 -
 90
90 -
 91
91 -
 92
92 -
 93
93 -
 94
94 -
 95
95 -
 96
96 -
 97
97 -
 98
98 -
 99
99 -
 100
100 -
 101
101 -
 102
102 -
 103
103 -
 104
104 -
 105
105 -
 106
106 -
107
-
108
-
109
-
110
-
111
-
112
-
113
-
114
-
115
-
116
-
117
-
118
-
119
-
120
-
121
-
122
-
123
-
124
-
125
-
126
-
127
-
128
-
129
-
130
-
131
-
132
-
133
-
134
-
135
-
136
-
137
-
138
-
139
-
140
-
141
-
142
-
143
-
144
-
145
-
146
-
147
-
148
-
149
-
150
-
151
-
152
-
153
-
154
-
155
-
156
-
157
-
158
-
159
-
160
-
161
-
162
-
163
-
164
-
165
-
166
-
167
-
168
-
169
-
170
-
171
-
172
-
173
-
174
 |
 |

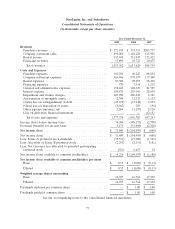
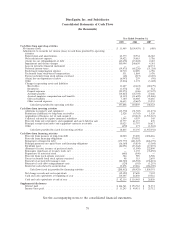
DineEquity, Inc. and Subsidiaries
Consolidated Statements of Operations
(In thousands, except per share amounts)
Year Ended December 31,
2009 2008 2007
Revenues
Franchise revenues ................................. $ 372,198 $ 353,331 $205,757
Company restaurant sales ............................ 890,020 1,103,228 125,905
Rental income .................................... 133,845 131,347 132,422
Financing revenues ................................. 17,899 25,722 20,475
Total revenues ................................... 1,413,962 1,613,628 484,559
Costs and Expenses
Franchise expenses ................................. 102,256 96,243 88,054
Company restaurant expenses ......................... 766,466 978,197 117,448
Rental expenses ................................... 97,303 98,057 98,402
Financing expenses ................................. 370 7,314 1,215
General and administrative expenses .................... 158,469 182,239 81,597
Interest expense ................................... 186,473 203,141 28,654
Impairment and closure charges ........................ 105,094 240,630 4,381
Amortization of intangible assets ....................... 12,306 12,132 1,132
(Gain) loss on extinguishment of debt ................... (45,678) (15,242) 2,223
(Gain) loss on disposition of assets ..................... (6,947) 259 (98)
Other expense (income), net .......................... 1,266 (1,185) 2,128
Loss on derivative financial instrument ................... — — 62,131
Total costs and expenses ........................... 1,377,378 1,801,785 487,267
Income (loss) before income taxes ........................ 36,584 (188,157) (2,708)
Provision (benefit) for income taxes ...................... 5,175 (33,698) (2,228)
Net income (loss) .................................... $ 31,409 $ (154,459) $ (480)
Net income (loss) .................................... $ 31,409 $ (154,459) $ (480)
Less: Series A preferred stock dividends ................... (19,531) (19,000) (1,561)
Less: Accretion of Series B preferred stock ................. (2,291) (2,151) (181)
Less: Net (income) loss allocated to unvested participating
restricted stock .................................... (351) 6,417 34
Net income (loss) available to common stockholders .......... $ 9,236 $ (169,193) $ (2,188)
Net income (loss) available to common stockholders per share
Basic ........................................... $ 0.55 $ (10.09) $ (0.13)
Diluted ......................................... $ 0.55 $ (10.09) $ (0.13)
Weighted average shares outstanding
Basic ........................................... 16,917 16,764 17,232
Diluted ......................................... 16,917 16,764 17,232
Dividends declared per common share .................... — $ 1.00 $ 1.00
Dividends paid per common share ....................... — $ 1.00 $ 1.00
See the accompanying notes to the consolidated financial statements.
77