IHOP 2009 Annual Report Download - page 128
Download and view the complete annual report
Please find page 128 of the 2009 IHOP annual report below. You can navigate through the pages in the report by either clicking on the pages listed below, or by using the keyword search tool below to find specific information within the annual report.-
 1
1 -
2
-
3
-
4
-
5
-
6
-
7
-
8
-
9
-
10
-
11
-
12
-
13
-
14
-
15
-
16
-
17
-
18
-
19
-
20
-
21
-
22
-
23
-
24
-
25
-
26
-
27
-
28
-
29
-
30
-
31
-
32
-
33
-
34
-
35
-
36
-
37
-
38
-
39
-
40
-
41
-
42
-
43
-
44
-
45
-
46
-
47
-
48
-
49
-
50
-
51
-
52
-
53
-
54
-
55
-
56
-
57
-
58
-
59
-
60
-
61
-
62
-
63
-
64
-
65
-
66
-
67
-
68
-
69
-
70
-
71
-
72
-
73
-
74
-
75
-
76
-
77
-
78
-
79
-
80
-
81
-
82
-
83
-
84
-
85
-
86
-
87
-
88
-
89
-
90
-
91
-
92
-
93
-
94
-
95
-
96
-
97
-
98
-
99
-
100
-
101
-
102
-
103
-
104
-
105
-
106
-
107
-
108
-
109
-
110
-
111
-
112
-
113
-
114
-
115
-
116
-
117
-
 118
118 -
 119
119 -
 120
120 -
 121
121 -
 122
122 -
 123
123 -
 124
124 -
 125
125 -
 126
126 -
 127
127 -
 128
128 -
 129
129 -
 130
130 -
 131
131 -
 132
132 -
 133
133 -
 134
134 -
 135
135 -
 136
136 -
 137
137 -
 138
138 -
139
-
140
-
141
-
142
-
143
-
144
-
145
-
146
-
147
-
148
-
149
-
150
-
151
-
152
-
153
-
154
-
155
-
156
-
157
-
158
-
159
-
160
-
161
-
162
-
163
-
164
-
165
-
166
-
167
-
168
-
169
-
170
-
171
-
172
-
173
-
174
 |
 |

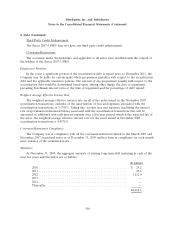
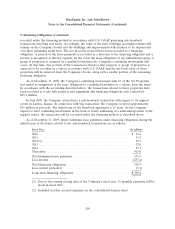
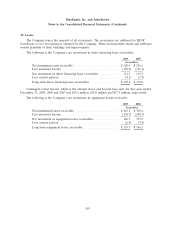
DineEquity, Inc. and Subsidiaries
Notes to the Consolidated Financial Statements (Continued)
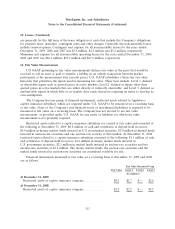
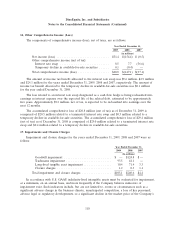
10. Leases
The Company leases the majority of all restaurants. The restaurants are subleased to IHOP
franchisees or in a few instances operated by the Company. These noncancelable leases and subleases
consist primarily of land, buildings and improvements.
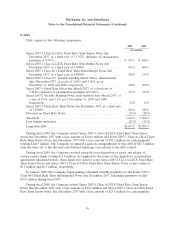
The following is the Company’s net investment in direct financing lease receivables:
2009 2008
(In millions)
Total minimum rents receivable ......................... $220.9 $ 241.6
Less unearned income ................................ (109.6) (126.1)
Net investment in direct financing lease receivables ........... 111.3 115.5
Less current portion ................................. (4.1) (3.5)
Long-term direct financing lease receivables ................ $107.2 $ 112.0
Contingent rental income, which is the amount above and beyond base rent, for the years ended
December 31, 2009, 2008 and 2007 was $15.6 million, $18.0 million and $17.5 million, respectively.
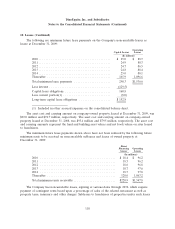
The following is the Company’s net investment in equipment leases receivable:
2009 2008
(In millions)
Total minimum leases receivable ........................ $283.2 $ 302.4
Less unearned income ................................ (136.7) (148.9)
Net investment in equipment leases receivables .............. 146.5 153.5
Less current portion ................................. (6.8) (7.0)
Long-term equipment leases receivable .................... $139.7 $ 146.5
109