IHOP 2009 Annual Report Download - page 131
Download and view the complete annual report
Please find page 131 of the 2009 IHOP annual report below. You can navigate through the pages in the report by either clicking on the pages listed below, or by using the keyword search tool below to find specific information within the annual report.-
 1
1 -
2
-
3
-
4
-
5
-
6
-
7
-
8
-
9
-
10
-
11
-
12
-
13
-
14
-
15
-
16
-
17
-
18
-
19
-
20
-
21
-
22
-
23
-
24
-
25
-
26
-
27
-
28
-
29
-
30
-
31
-
32
-
33
-
34
-
35
-
36
-
37
-
38
-
39
-
40
-
41
-
42
-
43
-
44
-
45
-
46
-
47
-
48
-
49
-
50
-
51
-
52
-
53
-
54
-
55
-
56
-
57
-
58
-
59
-
60
-
61
-
62
-
63
-
64
-
65
-
66
-
67
-
68
-
69
-
70
-
71
-
72
-
73
-
74
-
75
-
76
-
77
-
78
-
79
-
80
-
81
-
82
-
83
-
84
-
85
-
86
-
87
-
88
-
89
-
90
-
91
-
92
-
93
-
94
-
95
-
96
-
97
-
98
-
99
-
100
-
101
-
102
-
103
-
104
-
105
-
106
-
107
-
108
-
109
-
110
-
111
-
112
-
113
-
114
-
115
-
116
-
117
-
118
-
119
-
120
-
 121
121 -
 122
122 -
 123
123 -
 124
124 -
 125
125 -
 126
126 -
 127
127 -
 128
128 -
 129
129 -
 130
130 -
 131
131 -
 132
132 -
 133
133 -
 134
134 -
 135
135 -
 136
136 -
 137
137 -
 138
138 -
 139
139 -
 140
140 -
 141
141 -
142
-
143
-
144
-
145
-
146
-
147
-
148
-
149
-
150
-
151
-
152
-
153
-
154
-
155
-
156
-
157
-
158
-
159
-
160
-
161
-
162
-
163
-
164
-
165
-
166
-
167
-
168
-
169
-
170
-
171
-
172
-
173
-
174
 |
 |

DineEquity, Inc. and Subsidiaries
Notes to the Consolidated Financial Statements (Continued)
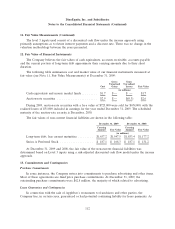
11. Fair Value Measurements (Continued)
The level 3 inputs used consist of a discounted cash flow under the income approach using
primarily assumptions as to future interest payments and a discount rate. There was no change in the
valuation methodology between the years presented.
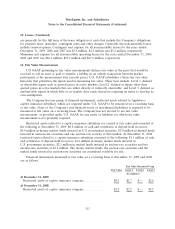
12. Fair Value of Financial Instruments
The Company believes the fair values of cash equivalents, accounts receivable, accounts payable
and the current portion of long-term debt approximate their carrying amounts due to their short
duration.
The following table summarizes cost and market value of our financial instruments measured at
fair value (see Note 11, Fair Value Measurements) at December 31, 2009:
Gross Gross
Unrealized Unrealized
Cost Gains Losses Fair Value
(in millions)
Cash equivalents and money market funds ......... $1.7 $ — $ — $1.7
Auction-rate securities ....................... $2.9 $ — $(0.3) $2.6
During 2009, auction-rate securities with a face value of $725,000 were sold for $674,000, with the
realized losses of $51,000 included in earnings for the year ended December 31, 2009. The scheduled
maturity of the auction-rate security is December, 2030.
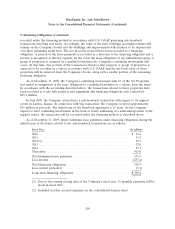
The fair values of non-current financial liabilities are shown in the following table:
December 31, 2009 December 31, 2008
Carrying Carrying
Amount Fair Value Amount Fair Value
(in millions)
Long-term debt, less current maturities ......... $1,637.2 $1,547.5 $1,853.4 $1,177.2
Series A Preferred Stock ................... $ 187.1 $ 168.3 $ 187.1 $ 131.2
At December 31, 2009 and 2008, the fair value of the non-current financial liabilities was
determined based on Level 3 inputs using a risk-adjusted discounted cash flow model under the income
approach.
13. Commitments and Contingencies
Purchase Commitments
In some instances, the Company enters into commitments to purchase advertising and other items.
Most of these agreements are fixed price purchase commitments. At December 31, 2009, the
outstanding purchase commitments were $62.8 million, the majority of which related to advertising.
Lease Guarantees and Contingencies
In connection with the sale of Applebee’s restaurants to franchisees and other parties, the
Company has, in certain cases, guaranteed or had potential continuing liability for lease payments. As
112