IHOP 2009 Annual Report Download - page 144
Download and view the complete annual report
Please find page 144 of the 2009 IHOP annual report below. You can navigate through the pages in the report by either clicking on the pages listed below, or by using the keyword search tool below to find specific information within the annual report.-
 1
1 -
2
-
3
-
4
-
5
-
6
-
7
-
8
-
9
-
10
-
11
-
12
-
13
-
14
-
15
-
16
-
17
-
18
-
19
-
20
-
21
-
22
-
23
-
24
-
25
-
26
-
27
-
28
-
29
-
30
-
31
-
32
-
33
-
34
-
35
-
36
-
37
-
38
-
39
-
40
-
41
-
42
-
43
-
44
-
45
-
46
-
47
-
48
-
49
-
50
-
51
-
52
-
53
-
54
-
55
-
56
-
57
-
58
-
59
-
60
-
61
-
62
-
63
-
64
-
65
-
66
-
67
-
68
-
69
-
70
-
71
-
72
-
73
-
74
-
75
-
76
-
77
-
78
-
79
-
80
-
81
-
82
-
83
-
84
-
85
-
86
-
87
-
88
-
89
-
90
-
91
-
92
-
93
-
94
-
95
-
96
-
97
-
98
-
99
-
100
-
101
-
102
-
103
-
104
-
105
-
106
-
107
-
108
-
109
-
110
-
111
-
112
-
113
-
114
-
115
-
116
-
117
-
118
-
119
-
120
-
121
-
122
-
123
-
124
-
125
-
126
-
127
-
128
-
129
-
130
-
131
-
132
-
133
-
 134
134 -
 135
135 -
 136
136 -
 137
137 -
 138
138 -
 139
139 -
 140
140 -
 141
141 -
 142
142 -
 143
143 -
 144
144 -
 145
145 -
 146
146 -
 147
147 -
 148
148 -
 149
149 -
 150
150 -
 151
151 -
 152
152 -
 153
153 -
 154
154 -
155
-
156
-
157
-
158
-
159
-
160
-
161
-
162
-
163
-
164
-
165
-
166
-
167
-
168
-
169
-
170
-
171
-
172
-
173
-
174
 |
 |

DineEquity, Inc. and Subsidiaries
Notes to the Consolidated Financial Statements (Continued)
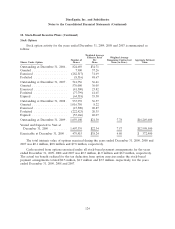
18. Stock-Based Incentive Plans (Continued)
The following table summarizes information regarding outstanding and exercisable options at
December 31, 2009:
Number of Weighted Weighted Weighted
Shares Average Average Number of Average
Outstanding Remaining Exercise Shares Exercise
as of Contractual Price Per Exercisable as of Price Per
Range of Exercise Prices 12/31/2009 Life Share 12/31/2009 Share
$5.55 - $5.55 ..................... 793,600 9.14 $ 5.50 — $ —
$5.90 -$16.37 ..................... 93,125 7.18 10.81 27,501 15.17
$20.09-$28.11 ..................... 65,665 2.47 24.18 65,665 24.18
$28.80-$29.10 ..................... 82,333 8.82 29.07 7,333 28.80
$31.09-$35.79 ..................... 81,666 5.54 33.71 51,666 35.23
$36.10-$38.88 ..................... 58,465 3.98 36.14 58,465 36.14
$40.00-$40.00 ..................... 276,000 8.15 40.00 92,002 40.00
$40.98-$46.92 ..................... 34,166 6.24 45.29 24,166 44.62
$47.90-$48.09 ..................... 145,346 5.09 48.07 135,346 48.08
$50.67-$62.00 ..................... 28,734 7.17 52.42 17,771 52.61
$5.55 -$62.00 ..................... 1,659,100 7.78 $21.30 479,915 $38.24
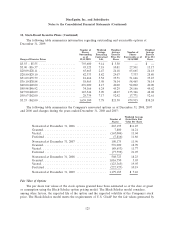
The following table summarizes the Company’s nonvested options as of December 31, 2008, 2007
and 2006 and changes during the years ended December 31, 2008 and 2007:
Weighted Average
Number of Grant-Date Fair
Shares Value Per Share
Nonvested at December 31, 2006 ................. 267,195 $11.25
Granted .................................... 7,800 14.21
Vested ..................................... (167,004) 11.04
Forfeited ................................... (7,816) 11.86
Nonvested at December 31, 2007 ................. 100,175 11.96
Granted .................................... 576,000 18.70
Vested ..................................... (89,653) 11.77
Forfeited ................................... (77,799) 21.07
Nonvested at December 31, 2008 ................. 508,723 18.23
Granted .................................... 1,016,750 5.03
Vested ..................................... (123,365) 19.95
Forfeited ................................... (222,923) 10.19
Nonvested at December 31, 2009 ................. 1,179,185 $ 7.10
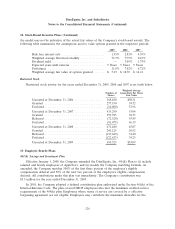
Fair Value of Options
The per share fair values of the stock options granted have been estimated as of the date of grant
or assumption using the Black-Scholes option pricing model. The Black-Scholes model considers,
among other factors, the expected life of the option and the expected volatility of the Company’s stock
price. The Black-Scholes model meets the requirements of U.S. GAAP but the fair values generated by
125