IHOP 2009 Annual Report Download - page 58
Download and view the complete annual report
Please find page 58 of the 2009 IHOP annual report below. You can navigate through the pages in the report by either clicking on the pages listed below, or by using the keyword search tool below to find specific information within the annual report.-
 1
1 -
2
-
3
-
4
-
5
-
6
-
7
-
8
-
9
-
10
-
11
-
12
-
13
-
14
-
15
-
16
-
17
-
18
-
19
-
20
-
21
-
22
-
23
-
24
-
25
-
26
-
27
-
28
-
29
-
30
-
31
-
32
-
33
-
34
-
35
-
36
-
37
-
38
-
39
-
40
-
41
-
42
-
43
-
44
-
45
-
46
-
47
-
 48
48 -
 49
49 -
 50
50 -
 51
51 -
 52
52 -
 53
53 -
 54
54 -
 55
55 -
 56
56 -
 57
57 -
 58
58 -
 59
59 -
 60
60 -
 61
61 -
 62
62 -
 63
63 -
 64
64 -
 65
65 -
 66
66 -
 67
67 -
 68
68 -
69
-
70
-
71
-
72
-
73
-
74
-
75
-
76
-
77
-
78
-
79
-
80
-
81
-
82
-
83
-
84
-
85
-
86
-
87
-
88
-
89
-
90
-
91
-
92
-
93
-
94
-
95
-
96
-
97
-
98
-
99
-
100
-
101
-
102
-
103
-
104
-
105
-
106
-
107
-
108
-
109
-
110
-
111
-
112
-
113
-
114
-
115
-
116
-
117
-
118
-
119
-
120
-
121
-
122
-
123
-
124
-
125
-
126
-
127
-
128
-
129
-
130
-
131
-
132
-
133
-
134
-
135
-
136
-
137
-
138
-
139
-
140
-
141
-
142
-
143
-
144
-
145
-
146
-
147
-
148
-
149
-
150
-
151
-
152
-
153
-
154
-
155
-
156
-
157
-
158
-
159
-
160
-
161
-
162
-
163
-
164
-
165
-
166
-
167
-
168
-
169
-
170
-
171
-
172
-
173
-
174
 |
 |

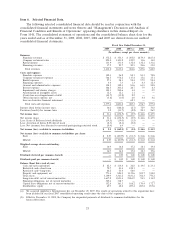
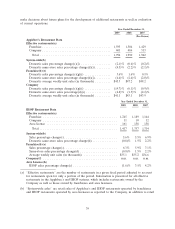
make decisions about future plans for the development of additional restaurants as well as evaluation
of current operations.
Year Ended December 31,
2009 2008 2007
(Pro Forma)
Applebee’s Restaurant Data
Effective restaurants(a)
Franchise ....................................... 1,595 1,504 1,429
Company ....................................... 401 486 513
Total ........................................ 1,996 1,990 1,942
System-wide(b)
Domestic sales percentage change(c)(i) ................. (2.1)% (0.4)% (0.2)%
Domestic same-store sales percentage change(d)(i) ......... (4.5)% (2.2)% (2.1)%
Franchise(b)(e)
Domestic sales percentage change(c)(g)(i) ............... 3.6% 1.6% 0.1%
Domestic same-store sales percentage change(d)(i) ......... (4.4)% (2.4)% (2.0)%
Domestic average weekly unit sales (in thousands) ......... $45.3 $47.2 $48.2
Company
Domestic sales percentage change(c)(g)(i) ............... (19.7)% (6.1)% (0.9)%
Domestic same-store sales percentage(d)(i) .............. (4.8)% (1.3)% (2.2)%
Domestic average weekly unit sales (in thousands) ......... $41.1 $43.1 $43.9
Year Ended December 31,
2009 2008 2007
IHOP Restaurant Data
Effective restaurants(a)
Franchise .......................................... 1,245 1,189 1,144
Company .......................................... 11 10 12
Area license ........................................ 161 158 158
Total ............................................ 1,417 1,357 1,314
System-wide(b)
Sales percentage change(c) .............................. 5.6% 5.5% 6.9%
Domestic same-store sales percentage change(d) .............. (0.8)% 1.5% 2.2%
Franchise(b)(e)
Sales percentage change(c) .............................. 6.3% 5.9% 7.1%
Same-store sales percentage change(d) ..................... (0.8)% 1.5% 2.2%
Average weekly unit sales (in thousands) ................... $35.1 $35.2 $34.6
Company(f) .......................................... n.m. n.m. n.m.
Area License(h)
IHOP sales percentage change(c) ......................... (1.6)% 3.1% 4.2%
(a) ‘‘Effective restaurants’’ are the number of restaurants in a given fiscal period adjusted to account
for restaurants open for only a portion of the period. Information is presented for all effective
restaurants in the Applebee’s and IHOP systems, which includes restaurants owned by the
Company as well as those owned by franchisees and area licensees.
(b) ‘‘System-wide sales’’ are retail sales of Applebee’s and IHOP restaurants operated by franchisees
and IHOP restaurants operated by area licensees as reported to the Company, in addition to retail
39