IHOP 2009 Annual Report Download - page 57
Download and view the complete annual report
Please find page 57 of the 2009 IHOP annual report below. You can navigate through the pages in the report by either clicking on the pages listed below, or by using the keyword search tool below to find specific information within the annual report.-
 1
1 -
2
-
3
-
4
-
5
-
6
-
7
-
8
-
9
-
10
-
11
-
12
-
13
-
14
-
15
-
16
-
17
-
18
-
19
-
20
-
21
-
22
-
23
-
24
-
25
-
26
-
27
-
28
-
29
-
30
-
31
-
32
-
33
-
34
-
35
-
36
-
37
-
38
-
39
-
40
-
41
-
42
-
43
-
44
-
45
-
46
-
 47
47 -
 48
48 -
 49
49 -
 50
50 -
 51
51 -
 52
52 -
 53
53 -
 54
54 -
 55
55 -
 56
56 -
 57
57 -
 58
58 -
 59
59 -
 60
60 -
 61
61 -
 62
62 -
 63
63 -
 64
64 -
 65
65 -
 66
66 -
 67
67 -
68
-
69
-
70
-
71
-
72
-
73
-
74
-
75
-
76
-
77
-
78
-
79
-
80
-
81
-
82
-
83
-
84
-
85
-
86
-
87
-
88
-
89
-
90
-
91
-
92
-
93
-
94
-
95
-
96
-
97
-
98
-
99
-
100
-
101
-
102
-
103
-
104
-
105
-
106
-
107
-
108
-
109
-
110
-
111
-
112
-
113
-
114
-
115
-
116
-
117
-
118
-
119
-
120
-
121
-
122
-
123
-
124
-
125
-
126
-
127
-
128
-
129
-
130
-
131
-
132
-
133
-
134
-
135
-
136
-
137
-
138
-
139
-
140
-
141
-
142
-
143
-
144
-
145
-
146
-
147
-
148
-
149
-
150
-
151
-
152
-
153
-
154
-
155
-
156
-
157
-
158
-
159
-
160
-
161
-
162
-
163
-
164
-
165
-
166
-
167
-
168
-
169
-
170
-
171
-
172
-
173
-
174
 |
 |

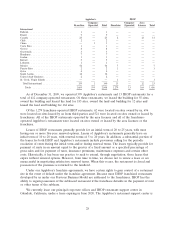
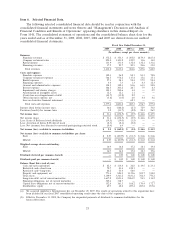
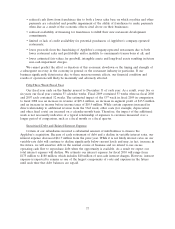
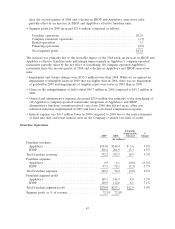
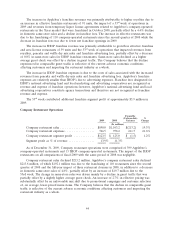
Significant Gains and Charges
There were several significant gains and charges that affect the comparisons of fiscal year 2009
results with previously reported periods, as presented in the following table:
Year ended December 31,
2009 2008 2007
(In millions)
Impairment and closure charges .................... $105.1 $240.6 $ 4.4
(Gain) loss on extinguishment of debt ................ (45.7) (15.2) 2.2
(Gain) loss on disposition of assets .................. (6.9) 0.3 (0.1)
Loss on derivative financial instrument ............... — — 62.1
Each transaction is discussed in further detail under paragraphs captioned with those descriptions
elsewhere in Item 7. Given the uncertainty as to the achievement of the forecasts used in assessing
possible impairment of tangible and intangible assets, it is reasonably possible that impairment charges
may occur in future periods. While the fair value of our debt is currently less than its carrying value
(see Note 12 of Notes to the Consolidated Financial Statements), the difference between fair value and
carrying value has decreased considerably over the past year. Therefore, while we expect to continue to
dedicate a portion of excess cash flow towards opportunistic debt retirement, it is likely that gains on
future extinguishments of debt will be smaller than those recognized in 2009 and 2008, if they occur at
all.
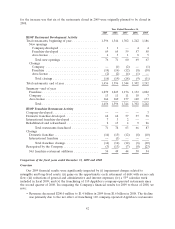
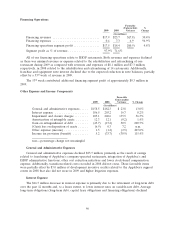
Financial Statement Effect of Franchising Company-Operated Restaurants
We have franchised 110 Applebee’s company-operated restaurants since the second quarter of 2008
and are planning to franchise a significant majority of the remaining 399 company-operated Applebee’s
over the next several years. As the number of company-operated restaurants declines, the amount of
Company restaurant revenues and Company restaurant expenses in future periods will decline
significantly compared to amounts reported in previous periods. Franchise royalty revenues and
expenses will likely increase as company-operated restaurants are franchised, although not in the same
magnitude as the Company restaurant revenues decline as franchise royalties are based on a percentage
of the franchisee’s revenues. Additionally, under terms of the securitized debt agreements, all of the
proceeds from asset sales must be used to retire long-term debt (at face value), which would result in a
decrease in interest expense in the future.
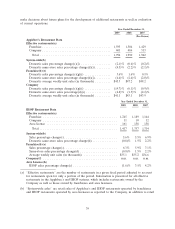
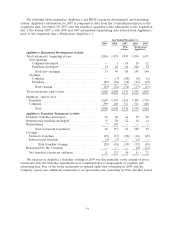
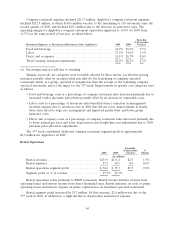
Restaurant Data
The following table sets forth, for each of the past three years, the number of effective restaurants
in the Applebee’s and IHOP systems and information regarding the percentage change in sales at those
restaurants compared to the same period in the prior year. Applebee’s information for 2007 is
comprised of data from the 11-month period prior to the acquisition date of November 29, 2007 and
one month of Applebee’s data subsequent to the acquisition date (‘‘Pro Forma 2007’’). ‘‘Effective
restaurants’’ are the number of restaurants in a given period, adjusted to account for restaurants open
for only a portion of the period. Information is presented for all effective restaurants in the Applebee’s
and IHOP systems, which includes restaurants owned by the Company, as well as those owned by
franchisees and area licensees. Sales of restaurants that are owned by franchisees and area licensees are
not attributable to the Company. However, we believe that presentation of this information is useful in
analyzing our revenues because franchisees and area licensees pay us royalties and advertising fees that
are generally based on a percentage of their sales, as well as, in some cases, rental payments under
leases that are usually based on a percentage of their sales. Management also uses this information to
38