IHOP 2009 Annual Report Download - page 65
Download and view the complete annual report
Please find page 65 of the 2009 IHOP annual report below. You can navigate through the pages in the report by either clicking on the pages listed below, or by using the keyword search tool below to find specific information within the annual report.-
 1
1 -
2
-
3
-
4
-
5
-
6
-
7
-
8
-
9
-
10
-
11
-
12
-
13
-
14
-
15
-
16
-
17
-
18
-
19
-
20
-
21
-
22
-
23
-
24
-
25
-
26
-
27
-
28
-
29
-
30
-
31
-
32
-
33
-
34
-
35
-
36
-
37
-
38
-
39
-
40
-
41
-
42
-
43
-
44
-
45
-
46
-
47
-
48
-
49
-
50
-
51
-
52
-
53
-
54
-
 55
55 -
 56
56 -
 57
57 -
 58
58 -
 59
59 -
 60
60 -
 61
61 -
 62
62 -
 63
63 -
 64
64 -
 65
65 -
 66
66 -
 67
67 -
 68
68 -
 69
69 -
 70
70 -
 71
71 -
 72
72 -
 73
73 -
 74
74 -
 75
75 -
76
-
77
-
78
-
79
-
80
-
81
-
82
-
83
-
84
-
85
-
86
-
87
-
88
-
89
-
90
-
91
-
92
-
93
-
94
-
95
-
96
-
97
-
98
-
99
-
100
-
101
-
102
-
103
-
104
-
105
-
106
-
107
-
108
-
109
-
110
-
111
-
112
-
113
-
114
-
115
-
116
-
117
-
118
-
119
-
120
-
121
-
122
-
123
-
124
-
125
-
126
-
127
-
128
-
129
-
130
-
131
-
132
-
133
-
134
-
135
-
136
-
137
-
138
-
139
-
140
-
141
-
142
-
143
-
144
-
145
-
146
-
147
-
148
-
149
-
150
-
151
-
152
-
153
-
154
-
155
-
156
-
157
-
158
-
159
-
160
-
161
-
162
-
163
-
164
-
165
-
166
-
167
-
168
-
169
-
170
-
171
-
172
-
173
-
174
 |
 |

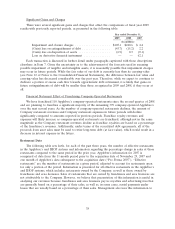
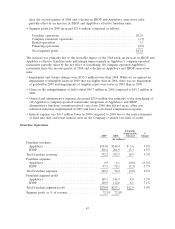
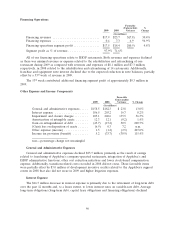
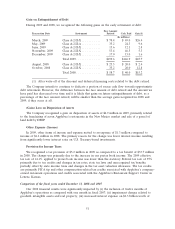
Financing Operations
Favorable
(Unfavorable) %
2009 2008 Variance Change
(In millions)
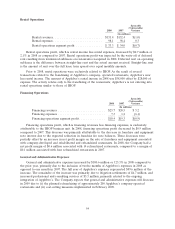
Financing revenues ........................... $17.9 $25.7 $(7.8) 30.4%
Financing expenses ........................... 0.4 7.3 6.9 94.9%
Financing operations segment profit ............... $17.5 $18.4 $(0.9) 4.8%
Segment profit as % of revenue .................. 97.9% 71.6%
All of our financing operations relate to IHOP restaurants. Both revenues and expenses declined
as there was minimal revenue or expense related to the rehabilitation and refranchising of one
restaurant during 2009 as compared with revenues and expenses of $8.1 million and $7.3 million,
respectively, in 2008 related to the rehabilitation and refranchising of 14 restaurants. Additionally,
franchise and equipment note interest declined due to the expected reduction in note balances, partially
offset by a 53rd week of revenue in 2009.
The 53rd week contributed additional financing segment profit of approximately $0.3 million in
2009.
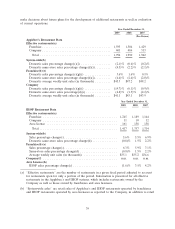
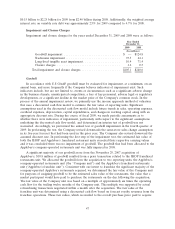
Other Expense and Income Components
Favorable
(Unfavorable)
2009 2008 Variance % Change
(In millions)
General and administrative expenses ..... $158.5 $182.3 $ 23.8 13.0%
Interest expense ................... 186.5 203.2 16.7 8.2%
Impairment and closure charges ........ 105.1 240.6 135.5 56.3%
Amortization of intangible assets ....... 12.3 12.1 (0.2) 1.4%
Gain on extinguishment of debt ........ (45.7) (15.2) 30.5 200.7%
(Gain) loss on disposition of assets ...... (6.9) 0.3 7.2 n.m.
Other expense (income) .............. 1.3 (1.2) (2.5) 207.0%
Income tax provision (benefit) ......... 5.2 (33.7) (38.9) 115.4%
n.m.—percentage change not meaningful
General and Administrative Expenses
General and administrative expenses declined $23.7 million, primarily as the result of savings
related to franchising of Applebee’s company-operated restaurants, integration of Applebee’s and
IHOP administrative functions, other cost reduction initiatives and lower stock-based compensation
expense. Additionally, transition-related costs recorded in 2008 did not recur. These favorable items
were partially offset by $3.0 million of development incentive credits related to the Applebee’s support
center in 2008 that also did not recur in 2009 and higher litigation expenses.
Interest Expense
The $16.7 million decrease in interest expense is primarily due to the retirement of long-term debt
over the past 12 months and, to a lesser extent, to lower interest rates on variable-rate debt. Average
long-term obligations (long-term debt, capital lease obligations and financing obligations) declined
46