IHOP 2009 Annual Report Download - page 143
Download and view the complete annual report
Please find page 143 of the 2009 IHOP annual report below. You can navigate through the pages in the report by either clicking on the pages listed below, or by using the keyword search tool below to find specific information within the annual report.-
 1
1 -
2
-
3
-
4
-
5
-
6
-
7
-
8
-
9
-
10
-
11
-
12
-
13
-
14
-
15
-
16
-
17
-
18
-
19
-
20
-
21
-
22
-
23
-
24
-
25
-
26
-
27
-
28
-
29
-
30
-
31
-
32
-
33
-
34
-
35
-
36
-
37
-
38
-
39
-
40
-
41
-
42
-
43
-
44
-
45
-
46
-
47
-
48
-
49
-
50
-
51
-
52
-
53
-
54
-
55
-
56
-
57
-
58
-
59
-
60
-
61
-
62
-
63
-
64
-
65
-
66
-
67
-
68
-
69
-
70
-
71
-
72
-
73
-
74
-
75
-
76
-
77
-
78
-
79
-
80
-
81
-
82
-
83
-
84
-
85
-
86
-
87
-
88
-
89
-
90
-
91
-
92
-
93
-
94
-
95
-
96
-
97
-
98
-
99
-
100
-
101
-
102
-
103
-
104
-
105
-
106
-
107
-
108
-
109
-
110
-
111
-
112
-
113
-
114
-
115
-
116
-
117
-
118
-
119
-
120
-
121
-
122
-
123
-
124
-
125
-
126
-
127
-
128
-
129
-
130
-
131
-
132
-
 133
133 -
 134
134 -
 135
135 -
 136
136 -
 137
137 -
 138
138 -
 139
139 -
 140
140 -
 141
141 -
 142
142 -
 143
143 -
 144
144 -
 145
145 -
 146
146 -
 147
147 -
 148
148 -
 149
149 -
 150
150 -
 151
151 -
 152
152 -
 153
153 -
154
-
155
-
156
-
157
-
158
-
159
-
160
-
161
-
162
-
163
-
164
-
165
-
166
-
167
-
168
-
169
-
170
-
171
-
172
-
173
-
174
 |
 |

DineEquity, Inc. and Subsidiaries
Notes to the Consolidated Financial Statements (Continued)
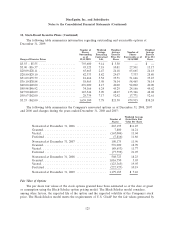
18. Stock-Based Incentive Plans (Continued)
Stock Options
Stock option activity for the years ended December 31, 2009, 2008 and 2007 is summarized as
follows:
Weighted Average
Exercise Price Weighted Average
Number of Per Remaining Contractual Aggregate Intrinsic
Shares Under Option Shares Share Term (in Years) Value
Outstanding at December 31, 2006 . 824,689 $34.71
Granted .................... 7,900 57.26
Exercised ................... (282,517) 31.69
Forfeited ................... (8,316) 48.67
Outstanding at December 31, 2007 . 541,756 36.41
Granted .................... 576,000 36.05
Exercised ................... (41,500) 23.82
Forfeited ................... (77,799) 41.65
Expired .................... (64,518) 35.50
Outstanding at December 31, 2008 . 933,939 36.37
Granted .................... 1,016,750 8.22
Exercised ................... (15,500) 20.87
Forfeited ................... (222,923) 20.35
Expired .................... (53,166) 40.07
Outstanding at December 31, 2009 . 1,659,100 $21.30 7.78 $16,249,600
Vested and Expected to Vest at
December 31, 2009 .......... 1,407,339 $22.34 7.57 $12,998,500
Exercisable at December 31, 2009 . 479,915 $38.24 4.80 $ 372,900
The total intrinsic value of options exercised during the years ended December 31, 2009, 2008 and
2007 was $0.1 million, $0.8 million and $7.8 million, respectively.
Cash received from options exercised under all stock-based payment arrangements for the years
ended December 31, 2009, 2008 and 2007 was $0.3 million, $1.0 million and $8.9 million, respectively.
The actual tax benefit realized for the tax deduction from option exercises under the stock-based
payment arrangements totaled $0.5 million, $1.9 million and $3.5 million, respectively, for the years
ended December 31, 2009, 2008 and 2007.
124