IHOP 2009 Annual Report Download - page 63
Download and view the complete annual report
Please find page 63 of the 2009 IHOP annual report below. You can navigate through the pages in the report by either clicking on the pages listed below, or by using the keyword search tool below to find specific information within the annual report.-
 1
1 -
2
-
3
-
4
-
5
-
6
-
7
-
8
-
9
-
10
-
11
-
12
-
13
-
14
-
15
-
16
-
17
-
18
-
19
-
20
-
21
-
22
-
23
-
24
-
25
-
26
-
27
-
28
-
29
-
30
-
31
-
32
-
33
-
34
-
35
-
36
-
37
-
38
-
39
-
40
-
41
-
42
-
43
-
44
-
45
-
46
-
47
-
48
-
49
-
50
-
51
-
52
-
 53
53 -
 54
54 -
 55
55 -
 56
56 -
 57
57 -
 58
58 -
 59
59 -
 60
60 -
 61
61 -
 62
62 -
 63
63 -
 64
64 -
 65
65 -
 66
66 -
 67
67 -
 68
68 -
 69
69 -
 70
70 -
 71
71 -
 72
72 -
 73
73 -
74
-
75
-
76
-
77
-
78
-
79
-
80
-
81
-
82
-
83
-
84
-
85
-
86
-
87
-
88
-
89
-
90
-
91
-
92
-
93
-
94
-
95
-
96
-
97
-
98
-
99
-
100
-
101
-
102
-
103
-
104
-
105
-
106
-
107
-
108
-
109
-
110
-
111
-
112
-
113
-
114
-
115
-
116
-
117
-
118
-
119
-
120
-
121
-
122
-
123
-
124
-
125
-
126
-
127
-
128
-
129
-
130
-
131
-
132
-
133
-
134
-
135
-
136
-
137
-
138
-
139
-
140
-
141
-
142
-
143
-
144
-
145
-
146
-
147
-
148
-
149
-
150
-
151
-
152
-
153
-
154
-
155
-
156
-
157
-
158
-
159
-
160
-
161
-
162
-
163
-
164
-
165
-
166
-
167
-
168
-
169
-
170
-
171
-
172
-
173
-
174
 |
 |

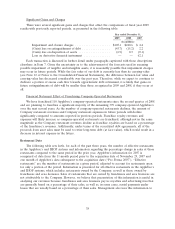
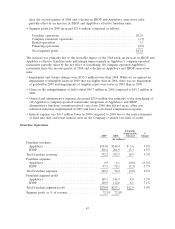
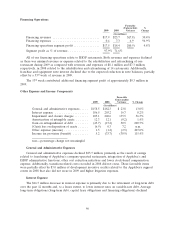
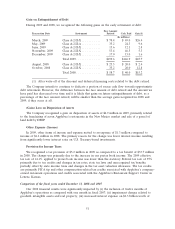
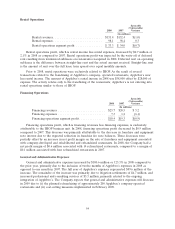
The increase in Applebee’s franchise revenues was primarily attributable to higher royalties due to
an increase in effective franchise restaurants of 91 units, the impact of a 53rd week of operations in
2009 and revenues from temporary liquor license agreements related to Applebee’s company-operated
restaurants in the Texas market that were franchised in October 2008, partially offset by a 4.4% decline
in domestic same-store sales and a decline in franchise fees. The increase in effective restaurants was
due to the franchising of 110 company-operated restaurants since the second quarter of 2008 while the
decrease in franchise fees was due to fewer net franchise openings in 2009.
The increase in IHOP franchise revenue was primarily attributable to growth in effective franchise
and area license restaurants of 59 units and the 53rd week of operations that impacted revenues from
royalties, pancake and waffle dry mix sales and franchise advertising fees, partially offset by a decrease
of 0.8% in same-store sales for IHOP franchise restaurants. Same-store sales declined as a higher
average guest check was offset by a decline in guest traffic. The Company believes that the decline
experienced in comparable guest traffic is reflective of the current adverse economic conditions
affecting customers and impacting the restaurant industry as a whole.
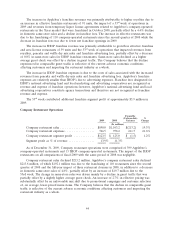
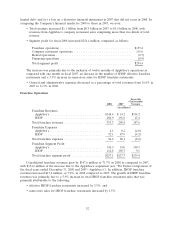
The increase in IHOP franchise expenses is due to the costs of sales associated with the increased
revenues from pancake and waffle dry mix sales and franchise advertising fees. Applebee’s franchise
expenses are relatively smaller than IHOP’s due to advertising expenses. Franchise fees designated for
IHOP’s national advertising fund and local marketing and advertising cooperatives are recognized as
revenue and expense of franchise operations; however, Applebee’s national advertising fund and local
advertising cooperatives constitute agency transactions and therefore are not recognized as franchise
revenue and expense.
The 53rd week contributed additional franchise segment profit of approximately $5.9 million in
2009.
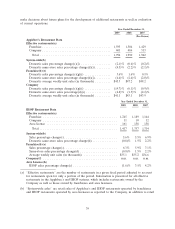
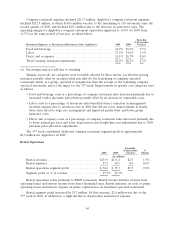
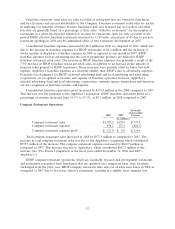
Company Restaurant Operations
Favorable
(Unfavorable) %
2009 2008 Variance Change
(In millions)
Company restaurant sales .................... $890.0 $1,103.2 $(213.2) 19.3%
Company restaurant expenses ................. 766.5 978.2 211.7 21.6%
Company restaurant segment profit ............ $123.5 $ 125.0 $ (1.5) 1.2%
Segment profit as % of revenue ............... 13.9% 11.3%
As of December 31, 2009, Company restaurant operations were comprised of 399 Applebee’s
company-operated restaurants and 13 IHOP company-operated restaurants. The impact of the IHOP
restaurants on all comparisons of fiscal 2009 with the same period of 2008 was negligible.
Company restaurant sales declined $213.2 million. Applebee’s company restaurant sales declined
$213.8 million, of which $192.1 million was due to the franchising of 110 restaurants since the second
quarter of 2008 and the full-year impact of three restaurant closures in 2008, in addition to a decrease
in domestic same-store sales of 4.8%, partially offset by an increase of $19.7 million due to the
53rd week. The change in same-store sales was driven mainly by a decline in guest traffic that was
partially offset by a slightly higher average guest check. An increase of 2.7% in effective pricing was
substantially offset by an unfavorable mix shift due to promotional campaigns and customer selection
of, on average, lower-priced menu items. The Company believes that the decline in comparable guest
traffic is reflective of the current adverse economic conditions affecting customers and impacting the
restaurant industry as a whole.
44