Chrysler 2005 Annual Report Download - page 71
Download and view the complete annual report
Please find page 71 of the 2005 Chrysler annual report below. You can navigate through the pages in the report by either clicking on the pages listed below, or by using the keyword search tool below to find specific information within the annual report.-
 1
1 -
2
-
3
-
4
-
5
-
6
-
7
-
8
-
9
-
10
-
11
-
12
-
13
-
14
-
15
-
16
-
17
-
18
-
19
-
20
-
21
-
22
-
23
-
24
-
25
-
26
-
27
-
28
-
29
-
30
-
31
-
32
-
33
-
34
-
35
-
36
-
37
-
38
-
39
-
40
-
41
-
42
-
43
-
44
-
45
-
46
-
47
-
48
-
49
-
50
-
51
-
52
-
53
-
54
-
55
-
56
-
57
-
58
-
59
-
60
-
 61
61 -
 62
62 -
 63
63 -
 64
64 -
 65
65 -
 66
66 -
 67
67 -
 68
68 -
 69
69 -
 70
70 -
 71
71 -
 72
72 -
 73
73 -
 74
74 -
 75
75 -
 76
76 -
 77
77 -
 78
78 -
 79
79 -
 80
80 -
 81
81 -
82
-
83
-
84
-
85
-
86
-
87
-
88
-
89
-
90
-
91
-
92
-
93
-
94
-
95
-
96
-
97
-
98
-
99
-
100
-
101
-
102
-
103
-
104
-
105
-
106
-
107
-
108
-
109
-
110
-
111
-
112
-
113
-
114
-
115
-
116
-
117
-
118
-
119
-
120
-
121
-
122
-
123
-
124
-
125
-
126
-
127
-
128
-
129
-
130
-
131
-
132
-
133
-
134
-
135
-
136
-
137
-
138
-
139
-
140
-
141
-
142
-
143
-
144
-
145
-
146
-
147
-
148
-
149
-
150
-
151
-
152
-
153
-
154
-
155
-
156
-
157
-
158
-
159
-
160
-
161
-
162
-
163
-
164
-
165
-
166
-
167
-
168
-
169
-
170
-
171
-
172
-
173
-
174
-
175
-
176
-
177
-
178
-
179
-
180
-
181
-
182
-
183
-
184
-
185
-
186
-
187
-
188
-
189
-
190
-
191
-
192
-
193
-
194
-
195
-
196
-
197
-
198
-
199
-
200
-
201
-
202
-
203
-
204
-
205
-
206
-
207
-
208
-
209
-
210
-
211
-
212
-
213
-
214
-
215
-
216
-
217
-
218
-
219
-
220
-
221
-
222
-
223
-
224
-
225
-
226
-
227
-
228
-
229
-
230
-
231
-
232
-
233
-
234
-
235
-
236
-
237
-
238
-
239
-
240
-
241
-
242
-
243
-
244
-
245
-
246
-
247
-
248
-
249
-
250
-
251
-
252
-
253
-
254
-
255
-
256
-
257
-
258
-
259
-
260
-
261
-
262
-
263
-
264
-
265
-
266
-
267
-
268
-
269
-
270
-
271
-
272
-
273
-
274
-
275
-
276
-
277
-
278
 |
 |

70 Reporton Operations Comau
01 Report on Operations
Operating Performance
In 2005, the Sector’s reference markets continued to be impacted
by uncertainty, shrinking volumes and intense pressure on prices.
Most car makers in the Western world scaled back their investment
programs.Though continuing to put new models on the market,
they focused on converting existing facilities and rationalising
production capacity. Major greenfield investments, on the other
hand, were suspended or postponed.
By contrast, a number of countries in Asia and Eastern Europe have
shown a sharp rise in investments, often through joint ventures
between Western car manufacturers and local partners.
Comau continued to restructure its business portfolio, with the
transfer of its European service activities to Iveco, Magneti Marelli
and CNH, effective January 1, 2005. If the effect of changes in the
scope of consolidation is not taken into account, revenues rose by
approximately 6%, largely because of the strong performance shown
bythe Bodywork and Service business units.
With markets shrinking nearly everywhere, new orders received
in 2005 totalled 1,448 million euros, 9% less than the previous
year on a comparable scope of consolidation.
In 2005, new orders for contract work came to 1,210 million euros,
a14% decrease over 2004 on a comparable scope of activity. Overall,
48% of the orders for contract workwere acquired in Europe and
35% in the Nafta area, while the remaining 17% came from the
Mercosur and new markets (7% from China). 17% of all orders came
from Fiat Group companies and 83% from other manufacturers.
At December 31, 2005, the backlog amounted to 713 million euros,
adecrease of approximately 20% from the previous year on a
comparable basis.
For Service operations, 2005 saw a significant increase in orders, which
rose 30% on a comparable scope of activity.Total value reached 238
million euros, 26% of which coming from Fiat Group companies.
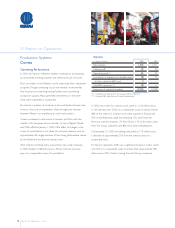
Production Systems
Comau
Highlights
(in millions of euros) 2005 2004
Net revenues 1,573 1,711
Trading profit 42 40
Operating result (*) (8)30
Investments in tangible and intangible assets 38 23
-of which capitalised R&D costs 9–
Total R&D expenses (**) 20 17
Employees at year-end (number) 12,725 13,328
(*) Including restructuring costs and unusual income (expenses).
(**) Including R&D capitalised and charged to operations.