Chrysler 2005 Annual Report Download - page 102
Download and view the complete annual report
Please find page 102 of the 2005 Chrysler annual report below. You can navigate through the pages in the report by either clicking on the pages listed below, or by using the keyword search tool below to find specific information within the annual report.-
 1
1 -
2
-
3
-
4
-
5
-
6
-
7
-
8
-
9
-
10
-
11
-
12
-
13
-
14
-
15
-
16
-
17
-
18
-
19
-
20
-
21
-
22
-
23
-
24
-
25
-
26
-
27
-
28
-
29
-
30
-
31
-
32
-
33
-
34
-
35
-
36
-
37
-
38
-
39
-
40
-
41
-
42
-
43
-
44
-
45
-
46
-
47
-
48
-
49
-
50
-
51
-
52
-
53
-
54
-
55
-
56
-
57
-
58
-
59
-
60
-
61
-
62
-
63
-
64
-
65
-
66
-
67
-
68
-
69
-
70
-
71
-
72
-
73
-
74
-
75
-
76
-
77
-
78
-
79
-
80
-
81
-
82
-
83
-
84
-
85
-
86
-
87
-
88
-
89
-
90
-
91
-
 92
92 -
 93
93 -
 94
94 -
 95
95 -
 96
96 -
 97
97 -
 98
98 -
 99
99 -
 100
100 -
 101
101 -
 102
102 -
 103
103 -
 104
104 -
 105
105 -
 106
106 -
 107
107 -
 108
108 -
 109
109 -
 110
110 -
 111
111 -
 112
112 -
113
-
114
-
115
-
116
-
117
-
118
-
119
-
120
-
121
-
122
-
123
-
124
-
125
-
126
-
127
-
128
-
129
-
130
-
131
-
132
-
133
-
134
-
135
-
136
-
137
-
138
-
139
-
140
-
141
-
142
-
143
-
144
-
145
-
146
-
147
-
148
-
149
-
150
-
151
-
152
-
153
-
154
-
155
-
156
-
157
-
158
-
159
-
160
-
161
-
162
-
163
-
164
-
165
-
166
-
167
-
168
-
169
-
170
-
171
-
172
-
173
-
174
-
175
-
176
-
177
-
178
-
179
-
180
-
181
-
182
-
183
-
184
-
185
-
186
-
187
-
188
-
189
-
190
-
191
-
192
-
193
-
194
-
195
-
196
-
197
-
198
-
199
-
200
-
201
-
202
-
203
-
204
-
205
-
206
-
207
-
208
-
209
-
210
-
211
-
212
-
213
-
214
-
215
-
216
-
217
-
218
-
219
-
220
-
221
-
222
-
223
-
224
-
225
-
226
-
227
-
228
-
229
-
230
-
231
-
232
-
233
-
234
-
235
-
236
-
237
-
238
-
239
-
240
-
241
-
242
-
243
-
244
-
245
-
246
-
247
-
248
-
249
-
250
-
251
-
252
-
253
-
254
-
255
-
256
-
257
-
258
-
259
-
260
-
261
-
262
-
263
-
264
-
265
-
266
-
267
-
268
-
269
-
270
-
271
-
272
-
273
-
274
-
275
-
276
-
277
-
278
 |
 |

101
Fiat Group Consolidated Financial Statements at December 31, 2005 - N otes to the Consolidated Financial Statements
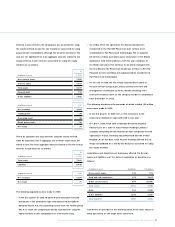
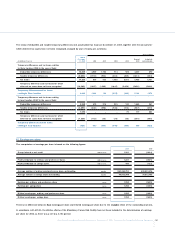
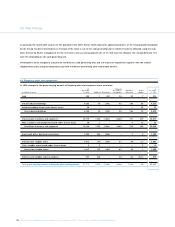
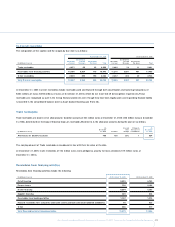
The totals of deductible and taxable temporary differences and accumulated tax losses at D ecember 31, 2005, together with the amounts for
which deferred tax assets have not been recognised, analysed by year of expiry, are as follows:
Year of expiry
Total at
December Beyond Unlimited/
(in millions of euros) 31, 2005 2006 2007 2008 2009 2009 indeterminable
Temporary differences and tax losses relating
to State taxation (IRES in the case of Italy):
Deductible temporary differences 12,855 4,929 1,704 714 509 4,327 672
Taxable temporary differences (6,804) (1,704) (904) (863) (825) (1,814) (694)
Tax losses 17,223 605 633 1,788 2,010 5,486 6,701
Temporary differences and tax losses for which
deferred tax assets have not been recognised (18,389) (1,987) (1,269) (1,845) (2,026) (5,856) (5,406)
Temporary differences and tax losses
relating to State taxation 4,885 1,843 164 (207) (332) 2,144 1,273
Temporary differences and tax losses relating
to local taxation (IRAP in the case of Italy):
Deductible temporary differences 3,389 675 218 235 140 1,860 261
Taxable temporary differences (3,857) (600) (558) (546) (514) (967) (672)
Tax losses 1,070 – – – 70 117 883
Temporary differences and tax losses for which
deferred tax assets have not been recognised (1,330) (163) (52) (35) (22) (360) (698)
Temporary differences and tax losses
relating to local taxation (728) (88) (392) (346) (326) 650 (226)
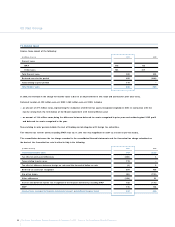
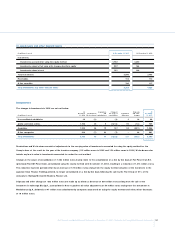
12. Earnings per share
The computation of earnings per share is based on the following figures:
2005 2004
Group interest in net result million euros 1,331 (1,634)
Profit attributable to ordinary and preference shares million euros 1,231 (1,501)
Profit attributable to savings shares million euros 100 (133)
Average number of ordinary and preference shares outstanding number 984,468,753 899,033,378
Average number of savings shares outstanding number 79,912,799 79,912,798
Earnings per ordinary and preference share euros 1.250 (1.699)
Earnings per savings share euros 1.250 (1.699)
Diluted earnings per ordinary and preference share euros 1.250 (1.699)
Diluted earnings per savings share euros 1.250 (1.699)
There is no difference between Basic earnings per share and D iluted earnings per share due to the negligible effect of the outstanding warrants.
In accordance with IAS 33, the dilutive effects of the Mandatory Convertible Facility have not been included in the determination of earnings
per share for 2004, as there was a net loss in the period.