Chrysler 2005 Annual Report Download - page 66
Download and view the complete annual report
Please find page 66 of the 2005 Chrysler annual report below. You can navigate through the pages in the report by either clicking on the pages listed below, or by using the keyword search tool below to find specific information within the annual report.-
 1
1 -
2
-
3
-
4
-
5
-
6
-
7
-
8
-
9
-
10
-
11
-
12
-
13
-
14
-
15
-
16
-
17
-
18
-
19
-
20
-
21
-
22
-
23
-
24
-
25
-
26
-
27
-
28
-
29
-
30
-
31
-
32
-
33
-
34
-
35
-
36
-
37
-
38
-
39
-
40
-
41
-
42
-
43
-
44
-
45
-
46
-
47
-
48
-
49
-
50
-
51
-
52
-
53
-
54
-
55
-
 56
56 -
 57
57 -
 58
58 -
 59
59 -
 60
60 -
 61
61 -
 62
62 -
 63
63 -
 64
64 -
 65
65 -
 66
66 -
 67
67 -
 68
68 -
 69
69 -
 70
70 -
 71
71 -
 72
72 -
 73
73 -
 74
74 -
 75
75 -
 76
76 -
77
-
78
-
79
-
80
-
81
-
82
-
83
-
84
-
85
-
86
-
87
-
88
-
89
-
90
-
91
-
92
-
93
-
94
-
95
-
96
-
97
-
98
-
99
-
100
-
101
-
102
-
103
-
104
-
105
-
106
-
107
-
108
-
109
-
110
-
111
-
112
-
113
-
114
-
115
-
116
-
117
-
118
-
119
-
120
-
121
-
122
-
123
-
124
-
125
-
126
-
127
-
128
-
129
-
130
-
131
-
132
-
133
-
134
-
135
-
136
-
137
-
138
-
139
-
140
-
141
-
142
-
143
-
144
-
145
-
146
-
147
-
148
-
149
-
150
-
151
-
152
-
153
-
154
-
155
-
156
-
157
-
158
-
159
-
160
-
161
-
162
-
163
-
164
-
165
-
166
-
167
-
168
-
169
-
170
-
171
-
172
-
173
-
174
-
175
-
176
-
177
-
178
-
179
-
180
-
181
-
182
-
183
-
184
-
185
-
186
-
187
-
188
-
189
-
190
-
191
-
192
-
193
-
194
-
195
-
196
-
197
-
198
-
199
-
200
-
201
-
202
-
203
-
204
-
205
-
206
-
207
-
208
-
209
-
210
-
211
-
212
-
213
-
214
-
215
-
216
-
217
-
218
-
219
-
220
-
221
-
222
-
223
-
224
-
225
-
226
-
227
-
228
-
229
-
230
-
231
-
232
-
233
-
234
-
235
-
236
-
237
-
238
-
239
-
240
-
241
-
242
-
243
-
244
-
245
-
246
-
247
-
248
-
249
-
250
-
251
-
252
-
253
-
254
-
255
-
256
-
257
-
258
-
259
-
260
-
261
-
262
-
263
-
264
-
265
-
266
-
267
-
268
-
269
-
270
-
271
-
272
-
273
-
274
-
275
-
276
-
277
-
278
 |
 |
65
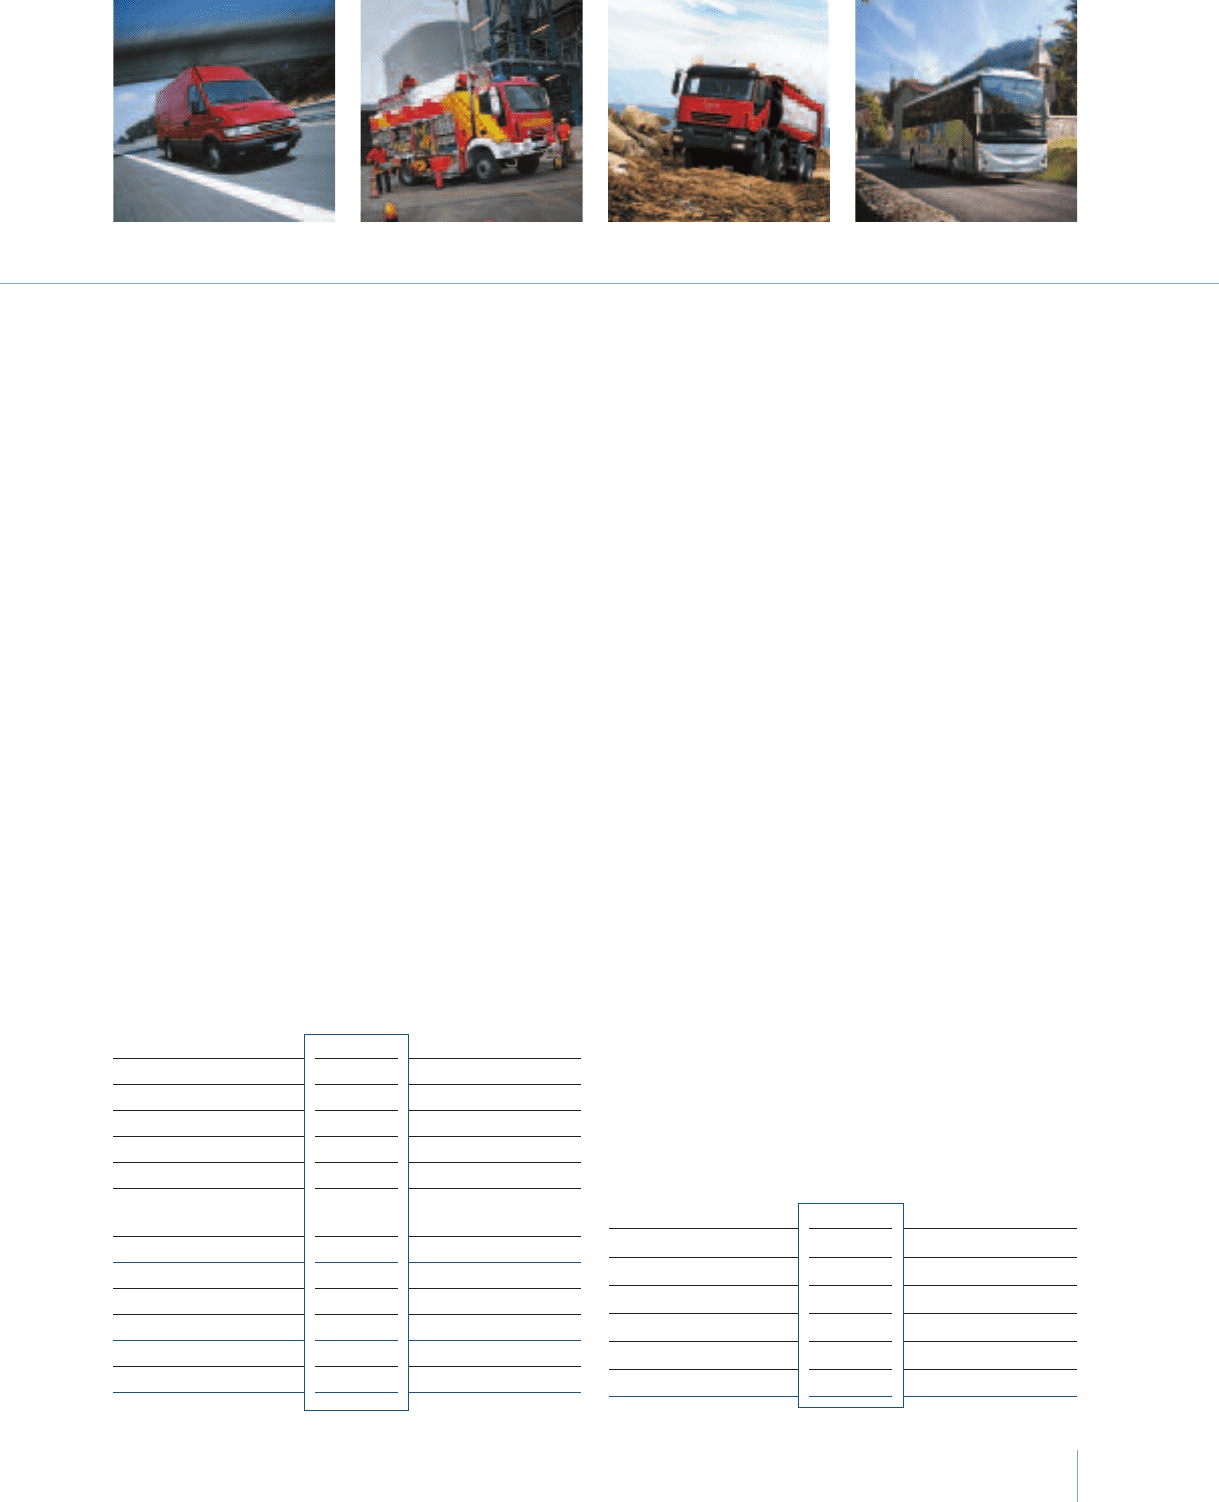
Report on Operations Iveco
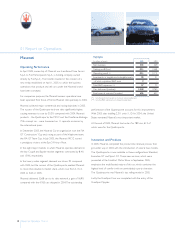
Iveco sold 172,500 vehicles worldwide (+6.3% compared with 2004).
The Sector’s affiliates in India and Turkey shipped approximately 64,800
units (+12.8%). In Western Europe, Iveco sold about 134,900 vehicles,
or 2.3% more than in the previous year.This positive sales performance
reflects favourable conditions in all European markets with the
exception of Italy, where the sales volume contracted by 3.8%. In the
rest of the world, sales volumes were buoyed by a strong performance
in Latin America, where Iveco shipped 11,900 vehicles, for a gain of
22.8% compared with 2004.
The Irisbus Group sold a total of 8,526 vehicles in 2005, in line with
the previous year (8,553 vehicles).
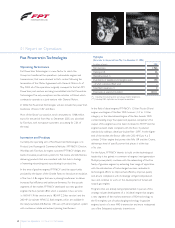
Iveco produced about 435,300 engines, about the same as in 2004.
41% of this production was used directly by the Sector, while 48%
of it was sold to CNH and Sevel, a joint venture between Fiat Auto
and the PSA Group.
The powertrain operations generated revenues of 2,554 million euros
in 2005 (58% coming from intra-Sector sales), for a year-over-year gain
of 6.3%, and a trading profit of 83 million euros, up from 76 million
euros in 2004.
In China, Naveco, a 50-50 joint venture with the Yueijin Group, produced
and sold around 18,000 light vehicles (+20% compared with 2004).
In Turkey, the Otoyol licensee sold 5,200 vehicles (about the same
as in 2004), while in India the associated company Ashok Leyland
manufactured and shipped 59,600 units (+14% compared with 2004).
Innovation and Products
Iveco’s R&D operations developed highly innovative solutions for all
three major vehicle components: chassis, engine and cab. Many of these
innovations are protected by international patents.
The Sector did further research in the areas of aerodynamics, welding
techniques that reduce weight by increasing the rigidity of a vehicle’s
body, cab structures that can absorb energy in the event of a crash and
cab climate control solutions.
In the field of advanced materials, research focused on high-resistance
steel, light alloys, nanocomposites, multifunctional glass and shape-
retaining intelligent materials. A total of 20 research projects have been
selected for their potential to deliver crucial advantages in the areas of
vehicle, cab and powertrain structure.
Studies in the transmission area focused on the use of new, low
friction lubricants and extremely high-resistance cast iron. Research in
the field of safety concentrated on developing integrated solutions that
use sensors to take advantage of such technologies as video cameras,
infrared video cameras and short-range and long-range radars.
In many cases, these innovative programs attracted the attention
of other Group Sectors, providing the opportunity for synergies.
In the area of environmental issues, Iveco introduced the Stralis
Euro 4/Euro 5, a heavy vehicle that is already in compliance with
2009 European emission ceilings.
With regard to its manufacturing processes, in keeping with the
guidelines provided in the 2004 Sustainability Report of the Fiat Group,
Iveco, which has already received ISO 14001 certification, made further
progress in applying EU principles to materials that can be recycled
at the end of a vehicle’s life. About 92% of the Daily van is made
with materials that can be recycled at the end of the vehicle’slife,
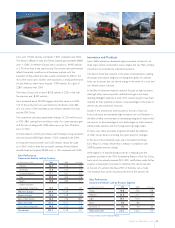
Sales Performance
Commercial Vehicles sold by Product Segment
(in thousands of units) 2005 2004 %change
Heavy 42.8 37.6 13.8
Medium 21.3 21.1 0.9
Light 95.7 91.0 5.1
Buses 8.5 8.6 –
Divisions (*) 4.2 4.0 3.5
Total units sold 172.5 162.3 6.3
(*) Astra, Defence and Fire-fighting Vehicles.
Sales Performance
Commercial Vehicles sold by Country
(in thousands of units) 2005 2004 % change
France 26.4 24.6 7.5
Germany 17.3 17.0 1.9
United Kingdom 17.1 16.1 6.5
Italy 39.0 40.6 -3.8
Spain 19.8 18.5 7.1
Other Western
European Countries 15.3 15.0 0.7
Western Europe 134.9 131.8 2.3
EasternEurope 13.3 12.9 3.0
Rest of the World 24.3 17.6 38.0
Total units sold 172.5 162.3 6.3
Associated companies 64.8 57.5 12.8
Grand total 237.3 219.8 8.0