Chrysler 2005 Annual Report Download - page 103
Download and view the complete annual report
Please find page 103 of the 2005 Chrysler annual report below. You can navigate through the pages in the report by either clicking on the pages listed below, or by using the keyword search tool below to find specific information within the annual report.-
 1
1 -
2
-
3
-
4
-
5
-
6
-
7
-
8
-
9
-
10
-
11
-
12
-
13
-
14
-
15
-
16
-
17
-
18
-
19
-
20
-
21
-
22
-
23
-
24
-
25
-
26
-
27
-
28
-
29
-
30
-
31
-
32
-
33
-
34
-
35
-
36
-
37
-
38
-
39
-
40
-
41
-
42
-
43
-
44
-
45
-
46
-
47
-
48
-
49
-
50
-
51
-
52
-
53
-
54
-
55
-
56
-
57
-
58
-
59
-
60
-
61
-
62
-
63
-
64
-
65
-
66
-
67
-
68
-
69
-
70
-
71
-
72
-
73
-
74
-
75
-
76
-
77
-
78
-
79
-
80
-
81
-
82
-
83
-
84
-
85
-
86
-
87
-
88
-
89
-
90
-
91
-
92
-
 93
93 -
 94
94 -
 95
95 -
 96
96 -
 97
97 -
 98
98 -
 99
99 -
 100
100 -
 101
101 -
 102
102 -
 103
103 -
 104
104 -
 105
105 -
 106
106 -
 107
107 -
 108
108 -
 109
109 -
 110
110 -
 111
111 -
 112
112 -
 113
113 -
114
-
115
-
116
-
117
-
118
-
119
-
120
-
121
-
122
-
123
-
124
-
125
-
126
-
127
-
128
-
129
-
130
-
131
-
132
-
133
-
134
-
135
-
136
-
137
-
138
-
139
-
140
-
141
-
142
-
143
-
144
-
145
-
146
-
147
-
148
-
149
-
150
-
151
-
152
-
153
-
154
-
155
-
156
-
157
-
158
-
159
-
160
-
161
-
162
-
163
-
164
-
165
-
166
-
167
-
168
-
169
-
170
-
171
-
172
-
173
-
174
-
175
-
176
-
177
-
178
-
179
-
180
-
181
-
182
-
183
-
184
-
185
-
186
-
187
-
188
-
189
-
190
-
191
-
192
-
193
-
194
-
195
-
196
-
197
-
198
-
199
-
200
-
201
-
202
-
203
-
204
-
205
-
206
-
207
-
208
-
209
-
210
-
211
-
212
-
213
-
214
-
215
-
216
-
217
-
218
-
219
-
220
-
221
-
222
-
223
-
224
-
225
-
226
-
227
-
228
-
229
-
230
-
231
-
232
-
233
-
234
-
235
-
236
-
237
-
238
-
239
-
240
-
241
-
242
-
243
-
244
-
245
-
246
-
247
-
248
-
249
-
250
-
251
-
252
-
253
-
254
-
255
-
256
-
257
-
258
-
259
-
260
-
261
-
262
-
263
-
264
-
265
-
266
-
267
-
268
-
269
-
270
-
271
-
272
-
273
-
274
-
275
-
276
-
277
-
278
 |
 |
102 Fiat Group Consolidated Financial Statements at D ecember 31, 2005 - N otes to the Consolidated Financial Statements
02 Fiat Group
Balance Sheet
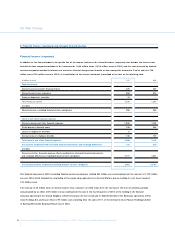
13. Intangible assets
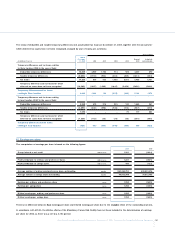
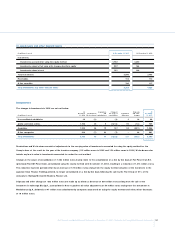
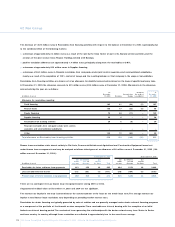
In 2005 changes in the gross carrying amount of Intangible assets were as follows:
Translation
At Changes in differences At
December the scope of and other D ecember
(in millions of euros) 31, 2004 Additions D ivestitures consolidation changes 31, 2005
Goodwill 2,809 – – 53 297 3,159
Trademarks and other intangible assets with indefinite useful lives 260 1 (4) 2 24 283
Development costs externally acquired 1,571 240 (7) (7) 25 1,822
Development costs internally generated 1,740 416 (2) – 78 2,232
Total Development costs 3,311 656 (9) (7) 103 4,054
Patents, concessions and licenses externally acquired 976 96 (114) (59) 100 999
Total Patents, concessions and licenses 976 96 (114) (59) 100 999
O ther intangible assets externally acquired 520 32 (9) 30 23 596
Total O ther intangible assets 520 32 (9) 30 23 596
Advances and intangible assets in progress externally acquired 119 51 – – (70) 100
Total Advances and intangible assets in progress 119 51 – – (70) 100
Total gross carrying amount of Intangible assets 7,995 836 (136) 19 477 9,191
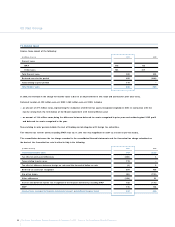
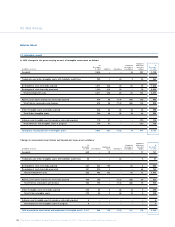
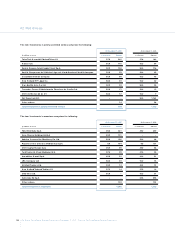
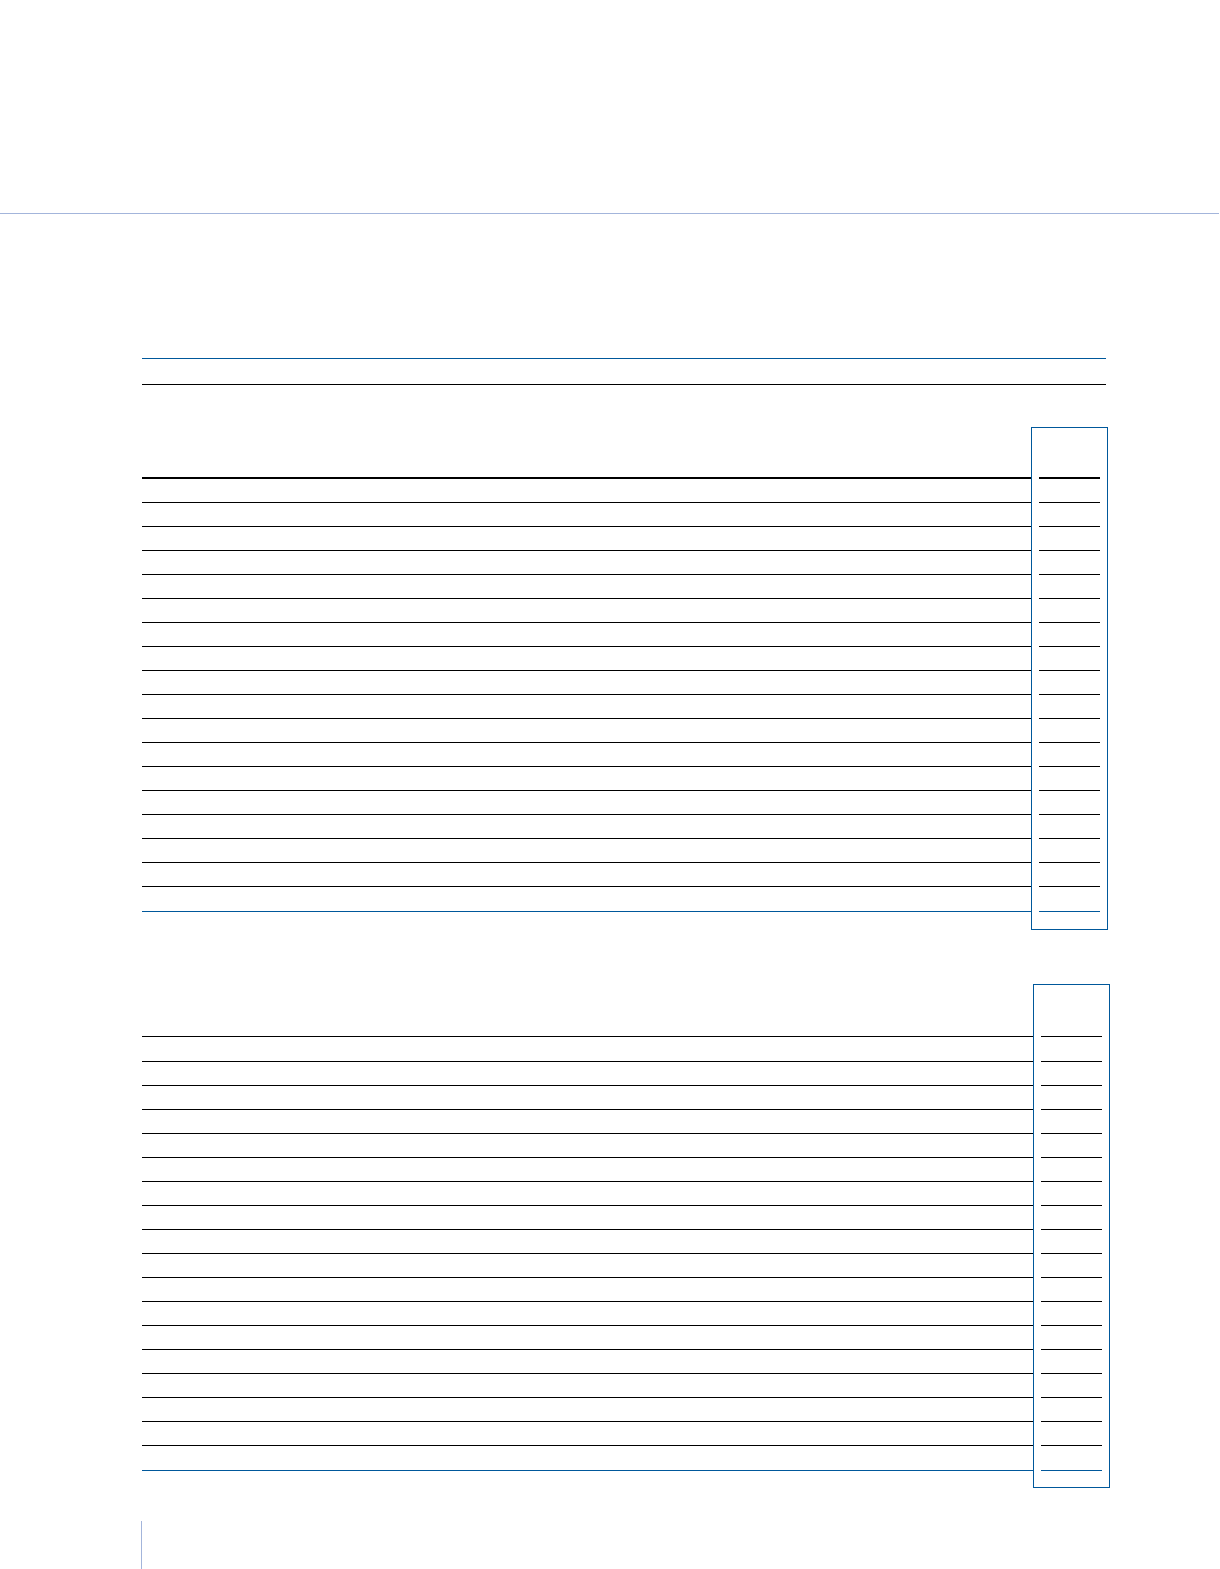
Changes in accumulated amortisation and impairment losses were as follows:
Translation
At Changes in differences At
December Impairment the scope of and other D ecember
(in millions of euros) 31, 2004 Amortisation losses D ivestitures consolidation changes 31, 2005
Goodwill 652 – 12 – – 77 741
Trademarks and other intangible assets with indefinite useful lives 58 – – (3) – 6 61
Development costs externally acquired 341 230 100 – (7) 3 667
Development costs internally generated 481 232 3 – – 68 784
Total Development costs 822 462 103 – (7) 71 1,451
Patents, concessions and licenses externally acquired 504 158 – (113) (38) 19 530
Total Patents, concessions and licenses 504 158 – (113) (38) 19 530
O ther intangible assets externally acquired 375 69 5 (9) 14 5 459
Total O ther intangible assets 375 69 5 (9) 14 5 459
Advances and intangible assets in progress externally acquired 6 – – – – – 6
Total Advances and intangible assets in progress 6 – – – – – 6
Total accumulated amortisation and impairment of Intangible assets 2,417 689 120 (125) (31) 178 3,248