Chrysler 2005 Annual Report Download - page 143
Download and view the complete annual report
Please find page 143 of the 2005 Chrysler annual report below. You can navigate through the pages in the report by either clicking on the pages listed below, or by using the keyword search tool below to find specific information within the annual report.-
 1
1 -
2
-
3
-
4
-
5
-
6
-
7
-
8
-
9
-
10
-
11
-
12
-
13
-
14
-
15
-
16
-
17
-
18
-
19
-
20
-
21
-
22
-
23
-
24
-
25
-
26
-
27
-
28
-
29
-
30
-
31
-
32
-
33
-
34
-
35
-
36
-
37
-
38
-
39
-
40
-
41
-
42
-
43
-
44
-
45
-
46
-
47
-
48
-
49
-
50
-
51
-
52
-
53
-
54
-
55
-
56
-
57
-
58
-
59
-
60
-
61
-
62
-
63
-
64
-
65
-
66
-
67
-
68
-
69
-
70
-
71
-
72
-
73
-
74
-
75
-
76
-
77
-
78
-
79
-
80
-
81
-
82
-
83
-
84
-
85
-
86
-
87
-
88
-
89
-
90
-
91
-
92
-
93
-
94
-
95
-
96
-
97
-
98
-
99
-
100
-
101
-
102
-
103
-
104
-
105
-
106
-
107
-
108
-
109
-
110
-
111
-
112
-
113
-
114
-
115
-
116
-
117
-
118
-
119
-
120
-
121
-
122
-
123
-
124
-
125
-
126
-
127
-
128
-
129
-
130
-
131
-
132
-
 133
133 -
 134
134 -
 135
135 -
 136
136 -
 137
137 -
 138
138 -
 139
139 -
 140
140 -
 141
141 -
 142
142 -
 143
143 -
 144
144 -
 145
145 -
 146
146 -
 147
147 -
 148
148 -
 149
149 -
 150
150 -
 151
151 -
 152
152 -
 153
153 -
154
-
155
-
156
-
157
-
158
-
159
-
160
-
161
-
162
-
163
-
164
-
165
-
166
-
167
-
168
-
169
-
170
-
171
-
172
-
173
-
174
-
175
-
176
-
177
-
178
-
179
-
180
-
181
-
182
-
183
-
184
-
185
-
186
-
187
-
188
-
189
-
190
-
191
-
192
-
193
-
194
-
195
-
196
-
197
-
198
-
199
-
200
-
201
-
202
-
203
-
204
-
205
-
206
-
207
-
208
-
209
-
210
-
211
-
212
-
213
-
214
-
215
-
216
-
217
-
218
-
219
-
220
-
221
-
222
-
223
-
224
-
225
-
226
-
227
-
228
-
229
-
230
-
231
-
232
-
233
-
234
-
235
-
236
-
237
-
238
-
239
-
240
-
241
-
242
-
243
-
244
-
245
-
246
-
247
-
248
-
249
-
250
-
251
-
252
-
253
-
254
-
255
-
256
-
257
-
258
-
259
-
260
-
261
-
262
-
263
-
264
-
265
-
266
-
267
-
268
-
269
-
270
-
271
-
272
-
273
-
274
-
275
-
276
-
277
-
278
 |
 |
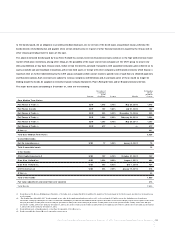
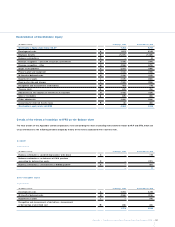
142 Fiat Group Consolidated Financial Statements at D ecember 31, 2005 - N otes to the Consolidated Financial Statements
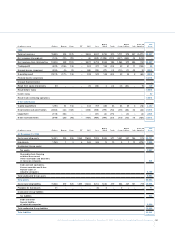
02 Fiat Group
Magneti Business O ther and FIAT
(in millions of euros) Fiat Auto Maserati Ferrari FPT CN H Iveco Marelli Teksid Comau Solutions Itedi eliminations Group
At D ecember 31, 2004
Sector operating assets 15,967 312 837 – 15,224 9,797 2,228 576 1,042 636 161 1,784 48,564
Investments 2,036 – 3 – 338 194 23 13 5 11 8 1,165 3,796
Unallocated Group assets:
Tax assets 3,182
Receivables from financing activities,
N on-current O ther receivables
and Securities of industrial companies 1,034
Cash and cash equivalents,
Current securities and O ther
financial assets of industrial companies 5,946
Total unallocated Group assets 10,162
Total assets 62,522
Sectors operating liabilities 15,269 302 428 – 12,128 8,342 1,371 389 823 604 165 1,440 41,261
Provision for investments – – – – – – – – – – – – –
Unallocated Group liabilities:
Tax liabilities 940
Debt and O ther
financial liabilities of industrial companies 15,393
Total unallocated Group liabilities 16,333
Total liabilities 57,594
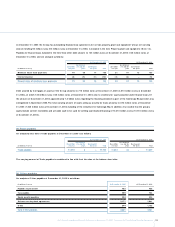
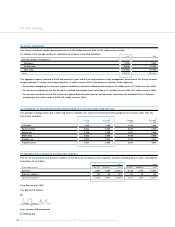
Geographical segment information
Geographical segment information on N et Revenues is based on the geographical location of the Group’s customers.
(in millions of euros) 2005 2004
Italy 13,078 14,903
Europe (Italy excluded) 18,518 17,646
N orth America 6,048 6,020
Mercosur 4,364 3,195
O ther areas 4,536 3,873
N et revenues of the Group 46,544 45,637
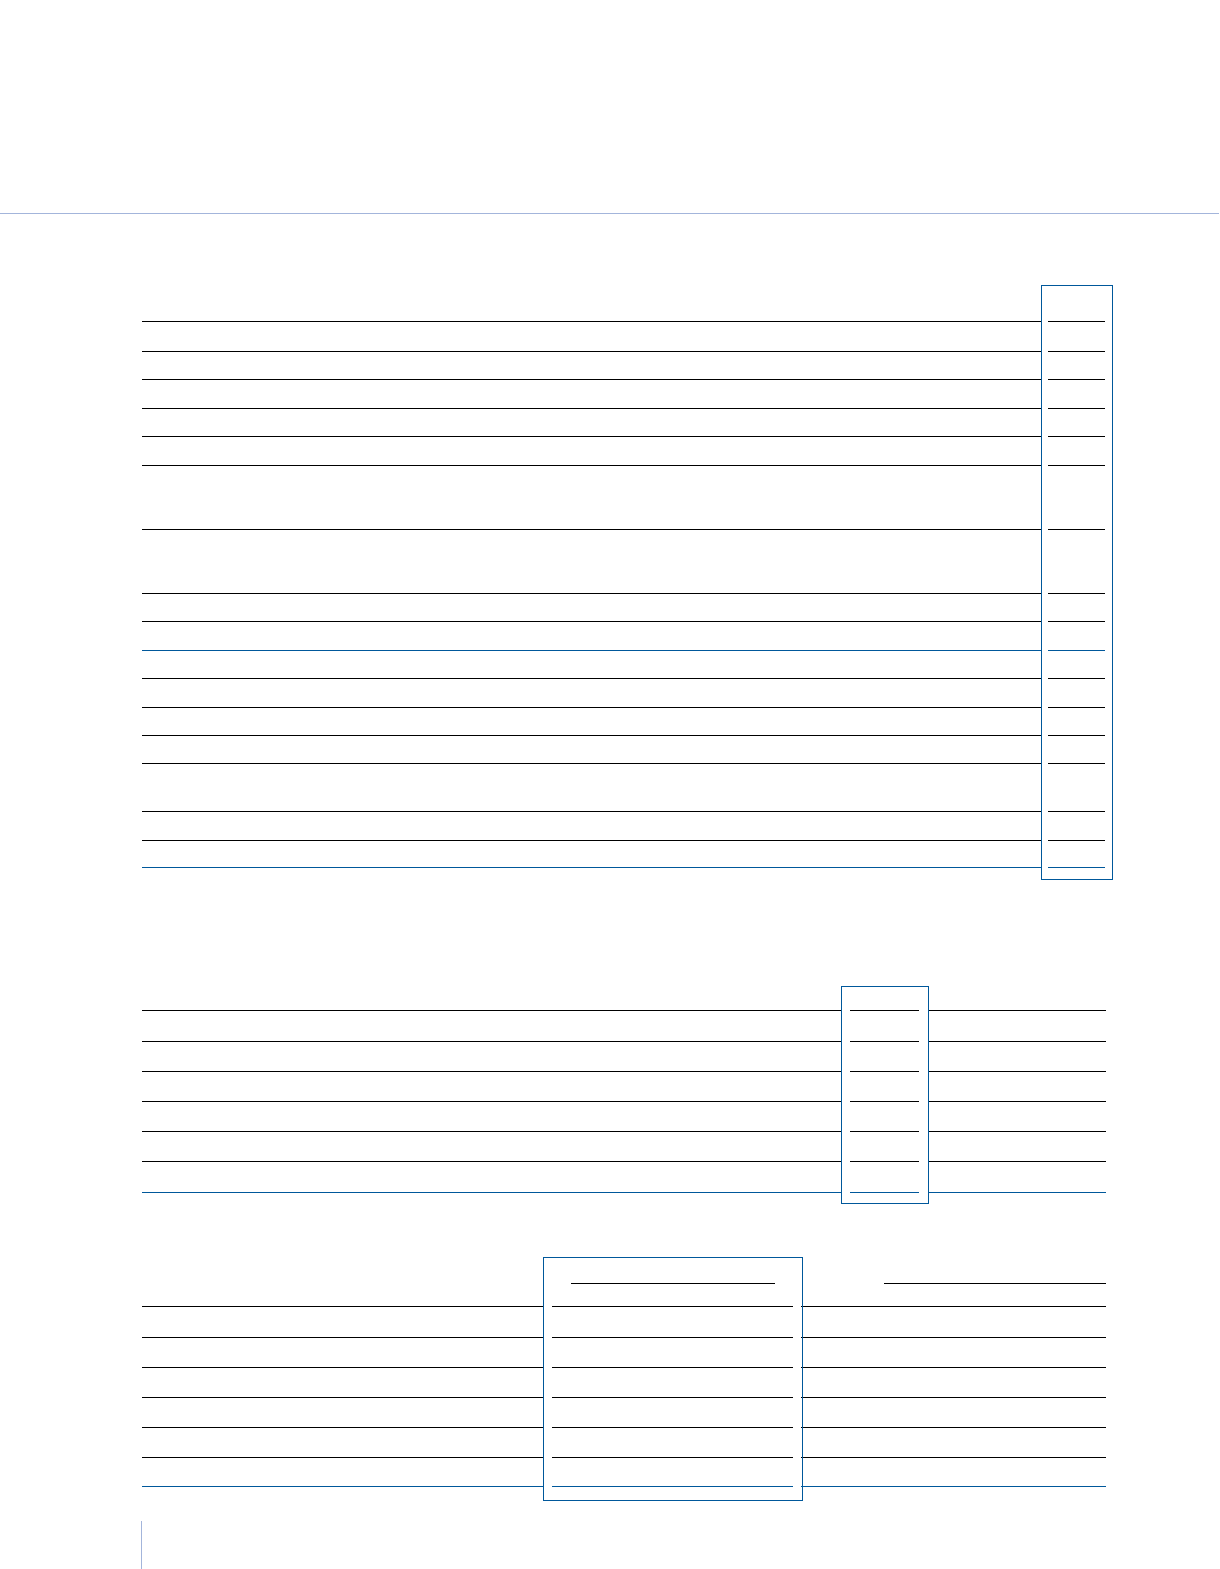
The total amount of Assets and Capital expenditure by geographical segment are as follows:
At December 31, 2005 At December 31, 2004
(in millions of euros) Assets Capital expenditure Assets Capital expenditure
Italy 24,737 2,075 26,147 2,047
Europe (Italy excluded) 15,908 1,011 18,516 919
N orth America 15,599 165 13,043 202
Mercosur 4,085 164 3,042 124
O ther areas 2,125 105 1,774 30
Total 62,454 3,520 62,522 3,322