Chrysler 2005 Annual Report Download - page 70
Download and view the complete annual report
Please find page 70 of the 2005 Chrysler annual report below. You can navigate through the pages in the report by either clicking on the pages listed below, or by using the keyword search tool below to find specific information within the annual report.-
 1
1 -
2
-
3
-
4
-
5
-
6
-
7
-
8
-
9
-
10
-
11
-
12
-
13
-
14
-
15
-
16
-
17
-
18
-
19
-
20
-
21
-
22
-
23
-
24
-
25
-
26
-
27
-
28
-
29
-
30
-
31
-
32
-
33
-
34
-
35
-
36
-
37
-
38
-
39
-
40
-
41
-
42
-
43
-
44
-
45
-
46
-
47
-
48
-
49
-
50
-
51
-
52
-
53
-
54
-
55
-
56
-
57
-
58
-
59
-
 60
60 -
 61
61 -
 62
62 -
 63
63 -
 64
64 -
 65
65 -
 66
66 -
 67
67 -
 68
68 -
 69
69 -
 70
70 -
 71
71 -
 72
72 -
 73
73 -
 74
74 -
 75
75 -
 76
76 -
 77
77 -
 78
78 -
 79
79 -
 80
80 -
81
-
82
-
83
-
84
-
85
-
86
-
87
-
88
-
89
-
90
-
91
-
92
-
93
-
94
-
95
-
96
-
97
-
98
-
99
-
100
-
101
-
102
-
103
-
104
-
105
-
106
-
107
-
108
-
109
-
110
-
111
-
112
-
113
-
114
-
115
-
116
-
117
-
118
-
119
-
120
-
121
-
122
-
123
-
124
-
125
-
126
-
127
-
128
-
129
-
130
-
131
-
132
-
133
-
134
-
135
-
136
-
137
-
138
-
139
-
140
-
141
-
142
-
143
-
144
-
145
-
146
-
147
-
148
-
149
-
150
-
151
-
152
-
153
-
154
-
155
-
156
-
157
-
158
-
159
-
160
-
161
-
162
-
163
-
164
-
165
-
166
-
167
-
168
-
169
-
170
-
171
-
172
-
173
-
174
-
175
-
176
-
177
-
178
-
179
-
180
-
181
-
182
-
183
-
184
-
185
-
186
-
187
-
188
-
189
-
190
-
191
-
192
-
193
-
194
-
195
-
196
-
197
-
198
-
199
-
200
-
201
-
202
-
203
-
204
-
205
-
206
-
207
-
208
-
209
-
210
-
211
-
212
-
213
-
214
-
215
-
216
-
217
-
218
-
219
-
220
-
221
-
222
-
223
-
224
-
225
-
226
-
227
-
228
-
229
-
230
-
231
-
232
-
233
-
234
-
235
-
236
-
237
-
238
-
239
-
240
-
241
-
242
-
243
-
244
-
245
-
246
-
247
-
248
-
249
-
250
-
251
-
252
-
253
-
254
-
255
-
256
-
257
-
258
-
259
-
260
-
261
-
262
-
263
-
264
-
265
-
266
-
267
-
268
-
269
-
270
-
271
-
272
-
273
-
274
-
275
-
276
-
277
-
278
 |
 |
69
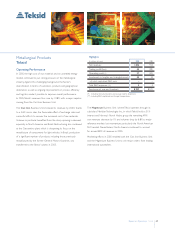
Report on Operations Teksid
Operating Performance
In 2005, the high cost of raw materials and an unsettled energy
market continued to put strong pressure on the metallurgical
industry. Against this challenging background, the Sector’s
diversification in terms of customers, products and geographical
destination, as well as ongoing improvements in process efficiency
and logistics, made it possible to improve overall performance.
In 2005,Teksid’s revenues thus rose by 13.8%, with a major impetus
coming from the Cast Iron Business Unit.
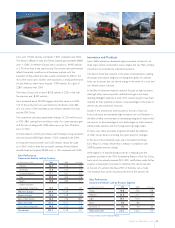
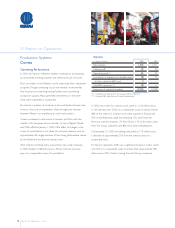
The Cast Iron Business Unit increased its revenues by 20.4% thanks
to a 4.6% rise in sales, the favourable effect of exchange rates and
successful efforts to recover the increased cost of raw materials.
Volumes in particular benefited from the sharp upswing in demand,
especiallyin North America and Brazil. Restructuring also continued
at the Crescentino plant, which is sharpening its focus on the
manufacture of components for light vehicles. In Brazil, production
of a significant number of products, including those previously
manufactured by the former General Motors foundries, was
transferred to the Sector’s plants in 2005.
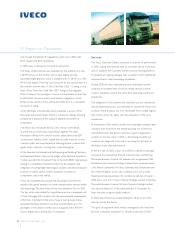
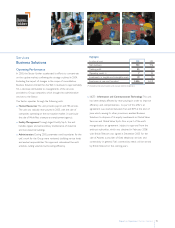
The Magnesium Business Unit (where Teksid operates through its
subsidiaryMeridian Technologies Inc., in which Teksid holds a 51%
interest and Norway’s Norsk Hydro group the remaining 49%)
sawrevenues decrease by1% and volumes drop by 6.8% as major
reference markets lost momentum, particularlythe North American
SUV market. Nevertheless, North America continued to account
for around 80% of revenues in 2005.
Marketing efforts in 2005 enabled both the Cast Iron Business Unit
and the Magnesium Business Unit to win major orders from leading
international automakers.
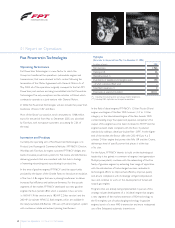
Metallurgical Products
Teksid
Highlights
(in millions of euros) 2005 2004
Net revenues 1,036 910
Trading profit/(loss) 45 (39)
Operating result (*) 27 (42)
Investments in tangible and intangible assets 45 44
-of which capitalised R&D costs ––
Total R&D expenses (**) 54
Employees at year-end (number) 8,952 8,571
(*) Including restructuring costs and unusual income (expenses).
(**) Including R&D capitalised and charged to operations.