Chrysler 2005 Annual Report Download - page 142
Download and view the complete annual report
Please find page 142 of the 2005 Chrysler annual report below. You can navigate through the pages in the report by either clicking on the pages listed below, or by using the keyword search tool below to find specific information within the annual report.-
 1
1 -
2
-
3
-
4
-
5
-
6
-
7
-
8
-
9
-
10
-
11
-
12
-
13
-
14
-
15
-
16
-
17
-
18
-
19
-
20
-
21
-
22
-
23
-
24
-
25
-
26
-
27
-
28
-
29
-
30
-
31
-
32
-
33
-
34
-
35
-
36
-
37
-
38
-
39
-
40
-
41
-
42
-
43
-
44
-
45
-
46
-
47
-
48
-
49
-
50
-
51
-
52
-
53
-
54
-
55
-
56
-
57
-
58
-
59
-
60
-
61
-
62
-
63
-
64
-
65
-
66
-
67
-
68
-
69
-
70
-
71
-
72
-
73
-
74
-
75
-
76
-
77
-
78
-
79
-
80
-
81
-
82
-
83
-
84
-
85
-
86
-
87
-
88
-
89
-
90
-
91
-
92
-
93
-
94
-
95
-
96
-
97
-
98
-
99
-
100
-
101
-
102
-
103
-
104
-
105
-
106
-
107
-
108
-
109
-
110
-
111
-
112
-
113
-
114
-
115
-
116
-
117
-
118
-
119
-
120
-
121
-
122
-
123
-
124
-
125
-
126
-
127
-
128
-
129
-
130
-
131
-
 132
132 -
 133
133 -
 134
134 -
 135
135 -
 136
136 -
 137
137 -
 138
138 -
 139
139 -
 140
140 -
 141
141 -
 142
142 -
 143
143 -
 144
144 -
 145
145 -
 146
146 -
 147
147 -
 148
148 -
 149
149 -
 150
150 -
 151
151 -
 152
152 -
153
-
154
-
155
-
156
-
157
-
158
-
159
-
160
-
161
-
162
-
163
-
164
-
165
-
166
-
167
-
168
-
169
-
170
-
171
-
172
-
173
-
174
-
175
-
176
-
177
-
178
-
179
-
180
-
181
-
182
-
183
-
184
-
185
-
186
-
187
-
188
-
189
-
190
-
191
-
192
-
193
-
194
-
195
-
196
-
197
-
198
-
199
-
200
-
201
-
202
-
203
-
204
-
205
-
206
-
207
-
208
-
209
-
210
-
211
-
212
-
213
-
214
-
215
-
216
-
217
-
218
-
219
-
220
-
221
-
222
-
223
-
224
-
225
-
226
-
227
-
228
-
229
-
230
-
231
-
232
-
233
-
234
-
235
-
236
-
237
-
238
-
239
-
240
-
241
-
242
-
243
-
244
-
245
-
246
-
247
-
248
-
249
-
250
-
251
-
252
-
253
-
254
-
255
-
256
-
257
-
258
-
259
-
260
-
261
-
262
-
263
-
264
-
265
-
266
-
267
-
268
-
269
-
270
-
271
-
272
-
273
-
274
-
275
-
276
-
277
-
278
 |
 |

141
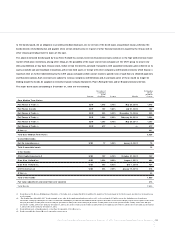
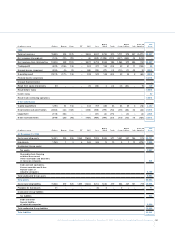
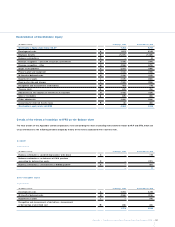
Fiat Group Consolidated Financial Statements at December 31, 2005 - N otes to the Consolidated Financial Statements
Magneti Business O ther and FIAT
(in millions of euros) Fiat Auto Maserati Ferrari FPT CN H Iveco Marelli Teksid Comau Solutions Itedi eliminations Group
2004
Total net revenues 19,695 409 1,175 – 9,983 9,047 3,795 910 1,711 976 407 (2,471) 45,637
N et revenues intersegment (169) (10) (72) – (6) (332) (1,226) (112) (427) (399) (9) 2,762 –
N et revenues from third parties 19,526 399 1,103 – 9,977 8,715 2,569 798 1,284 577 398 291 45,637
Trading profit (822)(168)138 – 467 371 165 (39)40 41 11 (154)50
Unusual income (expenses) (590) (3) (2) – (68) (24) (17) (3) (10) (7) (2) 91 (635)
O perating result (1,412)(171)136 – 399 347 148 (42)30 34 9 (63)(585)
Financial income (expenses) (1,179)
Unusual financial income –
Result from equity investments 89 – – – 20 (22) 3 (3) (4) (24) – 76 135
Result before taxes (1,629)
Income taxes 50
Result from continuing operations (1,579)
O ther information
Capital expenditure 1,793 51 143 – 243 737 280 44 23 25 2 (18)3,322
Depreciation and amortisation (1,082)(33)(108)–(302)(526)(175)(50)(29)(28)(6)(33)(2,372)
Impairment (118)(56)–––(21)(4)(75)–(2)–(4)(280)
O ther non-cash items (549)(25)(16)–(461)(487)(147)(33)(15)(13)(4)(121)(1,871)
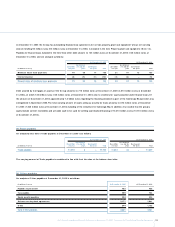
Magneti Business O ther and FIAT
(in millions of euros) Fiat Auto Maserati Ferrari FPT CN H Iveco Marelli Teksid Comau Solutions Itedi eliminations Group
At D ecember 31, 2005
Sector operating assets 16,231 235 936 2,362 17,860 7,510 2,363 671 1,091 341 186 915 50,701
Investments 1,780 1 3 6 385 346 13 13 5 1 12 (475) 2,090
Unallocated Group assets:
Tax assets 2,882
Receivables from financing
activities, N on-current
O ther receivables and Securities
of industrial companies 632
Cash and cash equivalents,
Current securities and O ther
financial assets of
industrial companies 6,149
Total unallocated Group assets 9,663
Total assets 62,454
Sector operating liabilities 15,638 270 625 1,255 14,483 6,213 1,620 419 828 437 161 719 42,668
Provision for investments 21 – – – – 46 2 – 2 – – – 71
Unallocated Group liabilities:
Tax liabilities 934
Debt and O ther
financial liabilities
of industrial companies 9,368
Total unallocated Group liabilities 10,302
Total liabilities 53,041