Chrysler 2005 Annual Report Download - page 62
Download and view the complete annual report
Please find page 62 of the 2005 Chrysler annual report below. You can navigate through the pages in the report by either clicking on the pages listed below, or by using the keyword search tool below to find specific information within the annual report.-
 1
1 -
2
-
3
-
4
-
5
-
6
-
7
-
8
-
9
-
10
-
11
-
12
-
13
-
14
-
15
-
16
-
17
-
18
-
19
-
20
-
21
-
22
-
23
-
24
-
25
-
26
-
27
-
28
-
29
-
30
-
31
-
32
-
33
-
34
-
35
-
36
-
37
-
38
-
39
-
40
-
41
-
42
-
43
-
44
-
45
-
46
-
47
-
48
-
49
-
50
-
51
-
 52
52 -
 53
53 -
 54
54 -
 55
55 -
 56
56 -
 57
57 -
 58
58 -
 59
59 -
 60
60 -
 61
61 -
 62
62 -
 63
63 -
 64
64 -
 65
65 -
 66
66 -
 67
67 -
 68
68 -
 69
69 -
 70
70 -
 71
71 -
 72
72 -
73
-
74
-
75
-
76
-
77
-
78
-
79
-
80
-
81
-
82
-
83
-
84
-
85
-
86
-
87
-
88
-
89
-
90
-
91
-
92
-
93
-
94
-
95
-
96
-
97
-
98
-
99
-
100
-
101
-
102
-
103
-
104
-
105
-
106
-
107
-
108
-
109
-
110
-
111
-
112
-
113
-
114
-
115
-
116
-
117
-
118
-
119
-
120
-
121
-
122
-
123
-
124
-
125
-
126
-
127
-
128
-
129
-
130
-
131
-
132
-
133
-
134
-
135
-
136
-
137
-
138
-
139
-
140
-
141
-
142
-
143
-
144
-
145
-
146
-
147
-
148
-
149
-
150
-
151
-
152
-
153
-
154
-
155
-
156
-
157
-
158
-
159
-
160
-
161
-
162
-
163
-
164
-
165
-
166
-
167
-
168
-
169
-
170
-
171
-
172
-
173
-
174
-
175
-
176
-
177
-
178
-
179
-
180
-
181
-
182
-
183
-
184
-
185
-
186
-
187
-
188
-
189
-
190
-
191
-
192
-
193
-
194
-
195
-
196
-
197
-
198
-
199
-
200
-
201
-
202
-
203
-
204
-
205
-
206
-
207
-
208
-
209
-
210
-
211
-
212
-
213
-
214
-
215
-
216
-
217
-
218
-
219
-
220
-
221
-
222
-
223
-
224
-
225
-
226
-
227
-
228
-
229
-
230
-
231
-
232
-
233
-
234
-
235
-
236
-
237
-
238
-
239
-
240
-
241
-
242
-
243
-
244
-
245
-
246
-
247
-
248
-
249
-
250
-
251
-
252
-
253
-
254
-
255
-
256
-
257
-
258
-
259
-
260
-
261
-
262
-
263
-
264
-
265
-
266
-
267
-
268
-
269
-
270
-
271
-
272
-
273
-
274
-
275
-
276
-
277
-
278
 |
 |

61
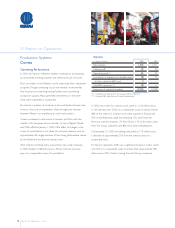
Report on Operations CNH
Operating Performance
In 2005, the worldwide market for agricultural equipment experienced
aslight increase in tractor sales (+5%) and a decline in combines
(-16%). In tractors, market demand was down in Latin America
(-19%) and Western Europe (-6%), it increased significantly in the
Rest of the World markets (26%) and remained flat in North America.
With respect to 2004, the combines market declined sharply in Latin
America (-58%), it increased in WesternEurope (+6%) and in the Rest
of the World markets (+10%) and remained flat in North America.
Sales of CNH tractors decreased across all regions with respect to
2004, except for the Rest of the World markets which recorded
an increase in volumes. Overall CNH reported a slight decrease
in market share. CNH unit sales of combines were also down
compared to 2004: a sharp decline in Latin America was only
partiallyoffset by higher volumes in North America and in the
Rest of the World markets. Overall market share was almost
unchanged; the decrease in Latin America was compensated by
the increase in the Rest of the World markets.
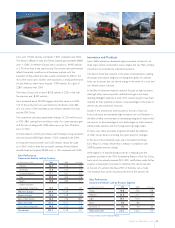
The global market for construction equipment expanded in 2005
compared to 2004 (+11%). Retail unit demand for loader backhoes
rose 15% worldwide thanks to a significant increase in Latin America
(+47%) and to growth on the North American market (+8%).
Market demand for skid steer loaders was up 4% worldwide as a
result of positive performances in Latin America (+34%) and
WesternEurope (+9%). Retail unit demand for heavy equipment
increased 8% worldwide, with sales growth posted in Latin America
(+18%), in North America (+15%) and in Western Europe (+4%).
In 2005, CNH benefited from the rising demand, increasing its total
shipments of construction equipment at a rate consistent with
that of the overall market in the different market regions. Only
in WesternEurope there was a slight decrease.
Agricultural and Construction Equipment
CNH
Highlights
(in millions of euros) 2005 2004
Net revenues 10,212 9,983
Trading profit 698 467
Operating result (*) 611 399
Investments in tangible and intangible assets 255 243
-of which capitalised R&D costs 40 32
Total R&D expenses (**) 234 221
Employees at year-end (number) 25,420 25,746
(*) Including restructuring costs and unusual income (expenses).
(**) Including R&D capitalised and charged to operations.