Chrysler 2005 Annual Report Download - page 131
Download and view the complete annual report
Please find page 131 of the 2005 Chrysler annual report below. You can navigate through the pages in the report by either clicking on the pages listed below, or by using the keyword search tool below to find specific information within the annual report.-
 1
1 -
2
-
3
-
4
-
5
-
6
-
7
-
8
-
9
-
10
-
11
-
12
-
13
-
14
-
15
-
16
-
17
-
18
-
19
-
20
-
21
-
22
-
23
-
24
-
25
-
26
-
27
-
28
-
29
-
30
-
31
-
32
-
33
-
34
-
35
-
36
-
37
-
38
-
39
-
40
-
41
-
42
-
43
-
44
-
45
-
46
-
47
-
48
-
49
-
50
-
51
-
52
-
53
-
54
-
55
-
56
-
57
-
58
-
59
-
60
-
61
-
62
-
63
-
64
-
65
-
66
-
67
-
68
-
69
-
70
-
71
-
72
-
73
-
74
-
75
-
76
-
77
-
78
-
79
-
80
-
81
-
82
-
83
-
84
-
85
-
86
-
87
-
88
-
89
-
90
-
91
-
92
-
93
-
94
-
95
-
96
-
97
-
98
-
99
-
100
-
101
-
102
-
103
-
104
-
105
-
106
-
107
-
108
-
109
-
110
-
111
-
112
-
113
-
114
-
115
-
116
-
117
-
118
-
119
-
120
-
 121
121 -
 122
122 -
 123
123 -
 124
124 -
 125
125 -
 126
126 -
 127
127 -
 128
128 -
 129
129 -
 130
130 -
 131
131 -
 132
132 -
 133
133 -
 134
134 -
 135
135 -
 136
136 -
 137
137 -
 138
138 -
 139
139 -
 140
140 -
 141
141 -
142
-
143
-
144
-
145
-
146
-
147
-
148
-
149
-
150
-
151
-
152
-
153
-
154
-
155
-
156
-
157
-
158
-
159
-
160
-
161
-
162
-
163
-
164
-
165
-
166
-
167
-
168
-
169
-
170
-
171
-
172
-
173
-
174
-
175
-
176
-
177
-
178
-
179
-
180
-
181
-
182
-
183
-
184
-
185
-
186
-
187
-
188
-
189
-
190
-
191
-
192
-
193
-
194
-
195
-
196
-
197
-
198
-
199
-
200
-
201
-
202
-
203
-
204
-
205
-
206
-
207
-
208
-
209
-
210
-
211
-
212
-
213
-
214
-
215
-
216
-
217
-
218
-
219
-
220
-
221
-
222
-
223
-
224
-
225
-
226
-
227
-
228
-
229
-
230
-
231
-
232
-
233
-
234
-
235
-
236
-
237
-
238
-
239
-
240
-
241
-
242
-
243
-
244
-
245
-
246
-
247
-
248
-
249
-
250
-
251
-
252
-
253
-
254
-
255
-
256
-
257
-
258
-
259
-
260
-
261
-
262
-
263
-
264
-
265
-
266
-
267
-
268
-
269
-
270
-
271
-
272
-
273
-
274
-
275
-
276
-
277
-
278
 |
 |

130 Fiat Group Consolidated Financial Statements at D ecember 31, 2005 - N otes to the Consolidated Financial Statements
02 Fiat Group
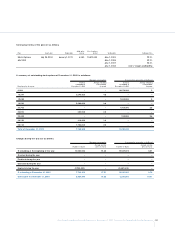
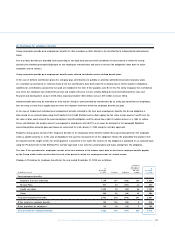
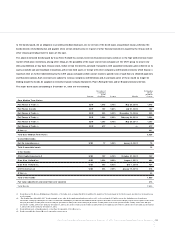
Changes in the present value of Post-employment obligations are as follows:
Employee
severance indemnity Pension Plans Health care plans O ther
(in millions of euros) 2005 2004 2005 2004 2005 2004 2005 2004
Present value of obligation at
the beginning of the year 1,243 1,265 2,710 2,593 1,186 1,095 278 275
Service cost 86 87 48 36 12 12 16 14
Interest costs 33 27 140 144 60 67 98
Contribution by plan participants ––5576––
Actuarial losses (gains) 47 64 129 152 177 188 817
Exchange rate differences ––181 (74) 187 (94) 5(2)
Benefits paid (150) (209) (157) (149) (64) (61) (39) (33)
Past service cost ––––(49)–2–
Change in scope of consolidation 158 7(1)1 ––24 –
Losses on curtailments –––1––(1)–
Plan amendments ––(8)–(98) (22) ––
O ther changes –261(1)(5)21 (1)
Present value of obligation at
the end of the year 1,417 1,243 3,053 2,710 1,417 1,186 323 278
The effect of plan amendments on the amount recognised for health care costs both in the income statement and in the changes in the
present value of obligations, is mainly due to the structural reduction in welfare costs in N orth America, which led to the recognition of
income of 83 million euros arising from the reduction of amounts previously provided by the CN H sector.
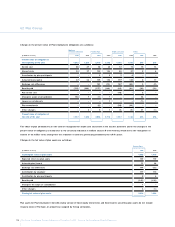
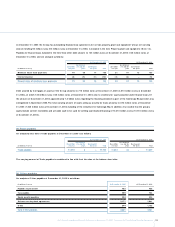
Changes in the fair value of plan assets are as follows:
Pension Plans
(in millions of euros) 2005 2004
O pening fair value of plan assets 1,623 1,476
Expected return on plan assets 127 119
Actuarial gains (losses) 71 39
Exchange rate differences 144 (53)
Contribution by employer 177 172
Contribution by plan participants 96
Benefits paid (142) (135)
Change in the scope of consolidation 1–
O ther changes 4(1)
Closing fair value of plan assets 2,014 1,623
Plan assets for Post-employment benefits mainly consist of listed equity instruments and fixed income securities; plan assets do not include
treasury stock of Fiat S.p.A. or properties occupied by Group companies.