Chrysler 2005 Annual Report Download - page 27
Download and view the complete annual report
Please find page 27 of the 2005 Chrysler annual report below. You can navigate through the pages in the report by either clicking on the pages listed below, or by using the keyword search tool below to find specific information within the annual report.-
 1
1 -
2
-
3
-
4
-
5
-
6
-
7
-
8
-
9
-
10
-
11
-
12
-
13
-
14
-
15
-
16
-
 17
17 -
 18
18 -
 19
19 -
 20
20 -
 21
21 -
 22
22 -
 23
23 -
 24
24 -
 25
25 -
 26
26 -
 27
27 -
 28
28 -
 29
29 -
 30
30 -
 31
31 -
 32
32 -
 33
33 -
 34
34 -
 35
35 -
 36
36 -
 37
37 -
38
-
39
-
40
-
41
-
42
-
43
-
44
-
45
-
46
-
47
-
48
-
49
-
50
-
51
-
52
-
53
-
54
-
55
-
56
-
57
-
58
-
59
-
60
-
61
-
62
-
63
-
64
-
65
-
66
-
67
-
68
-
69
-
70
-
71
-
72
-
73
-
74
-
75
-
76
-
77
-
78
-
79
-
80
-
81
-
82
-
83
-
84
-
85
-
86
-
87
-
88
-
89
-
90
-
91
-
92
-
93
-
94
-
95
-
96
-
97
-
98
-
99
-
100
-
101
-
102
-
103
-
104
-
105
-
106
-
107
-
108
-
109
-
110
-
111
-
112
-
113
-
114
-
115
-
116
-
117
-
118
-
119
-
120
-
121
-
122
-
123
-
124
-
125
-
126
-
127
-
128
-
129
-
130
-
131
-
132
-
133
-
134
-
135
-
136
-
137
-
138
-
139
-
140
-
141
-
142
-
143
-
144
-
145
-
146
-
147
-
148
-
149
-
150
-
151
-
152
-
153
-
154
-
155
-
156
-
157
-
158
-
159
-
160
-
161
-
162
-
163
-
164
-
165
-
166
-
167
-
168
-
169
-
170
-
171
-
172
-
173
-
174
-
175
-
176
-
177
-
178
-
179
-
180
-
181
-
182
-
183
-
184
-
185
-
186
-
187
-
188
-
189
-
190
-
191
-
192
-
193
-
194
-
195
-
196
-
197
-
198
-
199
-
200
-
201
-
202
-
203
-
204
-
205
-
206
-
207
-
208
-
209
-
210
-
211
-
212
-
213
-
214
-
215
-
216
-
217
-
218
-
219
-
220
-
221
-
222
-
223
-
224
-
225
-
226
-
227
-
228
-
229
-
230
-
231
-
232
-
233
-
234
-
235
-
236
-
237
-
238
-
239
-
240
-
241
-
242
-
243
-
244
-
245
-
246
-
247
-
248
-
249
-
250
-
251
-
252
-
253
-
254
-
255
-
256
-
257
-
258
-
259
-
260
-
261
-
262
-
263
-
264
-
265
-
266
-
267
-
268
-
269
-
270
-
271
-
272
-
273
-
274
-
275
-
276
-
277
-
278
 |
 |

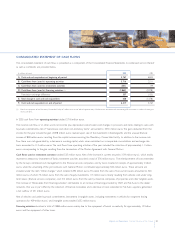
26 Reporton Operations Financial Review of the Group
01 Report on Operations
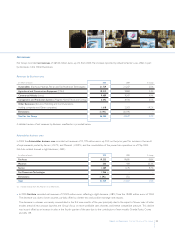
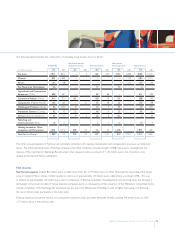
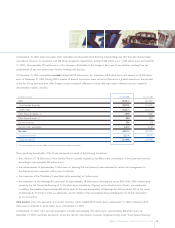
Trading profit
Trading profit increased significantly from 50 million euros in 2004 to 1,000 million euros in 2005.The 950 million euro increase is due to the
669 million euro reduction in the losses reported by the Automobiles business area (of which 541 million euros related to Fiat Auto), as well
as the positive performances of the other industrial Sectors. On the other hand, Other Businesses posted a decrease of 77 million euros.
Trading profit by Business area
(in millions of euros) 2005 2004 Change
Automobiles (Fiat Auto, Maserati, Ferrari and Fiat Powertrain Technologies) (183) (852) 669
Agricultural and Construction Equipment (CNH) 698 467 231
Commercial Vehicles (Iveco) 415 371 44
Components and Production Systems (Magneti Marelli,Teksid and Comau) 249 166 83
Other Businesses (Services, Publishing and Communications,
Holding companies and Other companies) and Eliminations (179) (102) -77
Total for the Group 1,000 50 950
The breakdown of trading profit by Business area/Sector is illustrated below.
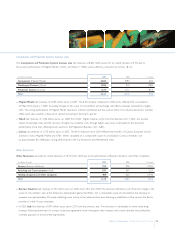
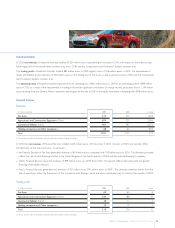
Automobiles business area
Trading profit of the Automobiles business area improved by 669 million euros, from a loss of 852 million euros in 2004 to a loss of 183
million euros in 2005.This improvement stemmed from the strong reduction in losses at Fiat Auto and Maserati, higher trading profit reported
by Ferrari and the consolidation of Fiat Powertrain Technologies.
(in millions of euros) 2005 2004 Change
Fiat Auto (281) (822) 541
Maserati (85) (168) 83
Ferrari 157 138 19
Fiat Powertrain Technologies 26 –26
Total (183) (852) 669
Fiat Auto had a trading loss of 281 million euros in 2005, a sharp improvement from the loss of 822 million euros of 2004. This change was
mainlyattributable to an improved product mix due to the new models, a reduction in product cost due to purchasing efficiencies, a strong
focus on more profitable sales channels and a drastic reduction in business governance costs.
The trading loss of Maserati was 85 million euros, as compared to a loss of 168 million euros in 2004, which included 46 million euros in
fixed asset write-downs. Higher sales volumes and a better product mix accounted for the further reduction in the Sector’s trading loss.
In 2005, Ferrari had a trading profit of 157 million euros, up from a profit of 138 million euros in 2004. The improvement reflected higher
sales volumes and efficiency gains, which were partially offset by the negative impact of exchange rates.
Fiat Powertrain Technologies achieved a trading profit of 26 million euros between Mayand December 2005.