Chrysler 2005 Annual Report Download - page 25
Download and view the complete annual report
Please find page 25 of the 2005 Chrysler annual report below. You can navigate through the pages in the report by either clicking on the pages listed below, or by using the keyword search tool below to find specific information within the annual report.-
 1
1 -
2
-
3
-
4
-
5
-
6
-
7
-
8
-
9
-
10
-
11
-
12
-
13
-
14
-
 15
15 -
 16
16 -
 17
17 -
 18
18 -
 19
19 -
 20
20 -
 21
21 -
 22
22 -
 23
23 -
 24
24 -
 25
25 -
 26
26 -
 27
27 -
 28
28 -
 29
29 -
 30
30 -
 31
31 -
 32
32 -
 33
33 -
 34
34 -
 35
35 -
36
-
37
-
38
-
39
-
40
-
41
-
42
-
43
-
44
-
45
-
46
-
47
-
48
-
49
-
50
-
51
-
52
-
53
-
54
-
55
-
56
-
57
-
58
-
59
-
60
-
61
-
62
-
63
-
64
-
65
-
66
-
67
-
68
-
69
-
70
-
71
-
72
-
73
-
74
-
75
-
76
-
77
-
78
-
79
-
80
-
81
-
82
-
83
-
84
-
85
-
86
-
87
-
88
-
89
-
90
-
91
-
92
-
93
-
94
-
95
-
96
-
97
-
98
-
99
-
100
-
101
-
102
-
103
-
104
-
105
-
106
-
107
-
108
-
109
-
110
-
111
-
112
-
113
-
114
-
115
-
116
-
117
-
118
-
119
-
120
-
121
-
122
-
123
-
124
-
125
-
126
-
127
-
128
-
129
-
130
-
131
-
132
-
133
-
134
-
135
-
136
-
137
-
138
-
139
-
140
-
141
-
142
-
143
-
144
-
145
-
146
-
147
-
148
-
149
-
150
-
151
-
152
-
153
-
154
-
155
-
156
-
157
-
158
-
159
-
160
-
161
-
162
-
163
-
164
-
165
-
166
-
167
-
168
-
169
-
170
-
171
-
172
-
173
-
174
-
175
-
176
-
177
-
178
-
179
-
180
-
181
-
182
-
183
-
184
-
185
-
186
-
187
-
188
-
189
-
190
-
191
-
192
-
193
-
194
-
195
-
196
-
197
-
198
-
199
-
200
-
201
-
202
-
203
-
204
-
205
-
206
-
207
-
208
-
209
-
210
-
211
-
212
-
213
-
214
-
215
-
216
-
217
-
218
-
219
-
220
-
221
-
222
-
223
-
224
-
225
-
226
-
227
-
228
-
229
-
230
-
231
-
232
-
233
-
234
-
235
-
236
-
237
-
238
-
239
-
240
-
241
-
242
-
243
-
244
-
245
-
246
-
247
-
248
-
249
-
250
-
251
-
252
-
253
-
254
-
255
-
256
-
257
-
258
-
259
-
260
-
261
-
262
-
263
-
264
-
265
-
266
-
267
-
268
-
269
-
270
-
271
-
272
-
273
-
274
-
275
-
276
-
277
-
278
 |
 |

24 Reporton Operations Financial Review of the Group
01 Report on Operations
Fiat Auto delivered a total of 1,697,300 units in 2005, 3.9% less than in 2004. A total of 1,100,000 units were delivered in Western Europe
(-7.8%); the decline recorded for the year levelled off in the fourth quarter due to the positive contribution of new models. While sales
were down in most leading countries of Europe, the decline was less pronounced in Italy (-2.4%) and Spain (-3%). France represented
the exception, where deliveries increased by 8.3%. Fiat Auto had a 28% share of the Italian car market (the same as in 2004) and 6.5%
in Western Europe (-0.7 percentage points from 2004).
Outside Western Europe, the unfavourable trend of the Polish market severely impacted Fiat Auto sales, which fell by 44.3% from 2004.
In Brazil, Fiat Auto exploited expansion on the domestic market by increasing its sales 12.9% and achieving a 24.4% share of the car market
and a 28.8% share of the light commercial vehicle market, reflecting increases of 0.9 and 4.5 percentage points, respectively.
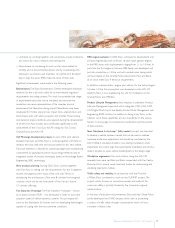
Maserati had revenues of 533 million euros in 2005. The significant improvement (30.3%) from 2004 was due to the success of the
Quattroporte and the sales of the special MC12 street version.
Ferrari posted revenues of 1,289 million euros in 2005. The 9.7% increase from 2004 was largely attributable to the good performance of the
F430 and 612 Scaglietti models. Revenues were also boosted by sales of the Superamerica and the FXX models, produced in limited edition.
Fiat Powertrain Technologies is the new Sector which groups all passenger car engine and transmission activities. Fiat regained control over
these activities in May2005 following termination of the Master Agreement with General Motors. Starting in 2006, the Sector will also
include the engine and transmission operations of Iveco, Centro Ricerche Fiat and Elasis.This Sector had revenues of 1,966 million euros
between May and December 2005.The Sector’s sales were realised in part with Fiat Auto and for 23% with third parties.
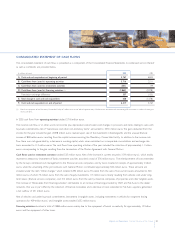
Agricultural and Construction Equipment
In 2005, CNH revenues totalled 10,212 million euros, up 2.3% from 2004. Higher sales of construction equipment and improved prices were
partially offset by lower agricultural equipment volume.
Demand for tractors was down in Western Europe and Latin America and stable in North America. CNH recorded decreases across all of
these regions. On the other hand, the increase in demand in Rest of the World markets drove the increase in sales recorded by CNH in this
region. Combine harvester volumes were stable in Western Europe, grew in North America and the rest of the world, but fell by half in Latin
America, reflecting a drastic downturn in demand in this market.
CNH benefited from the good performance of the global construction equipment market and reported an increase in sales volumes for all
the main products.The Sector performed well in Latin America, North America, and in the rest of the world, with the only slight decrease
being recorded in WesternEurope.
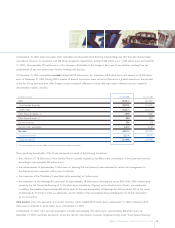
Iveco
Iveco revenues totalled 9,489 million euros in 2005. This represented a 4.9% increase, largely reflecting a higher number of units delivered
across its principal product lines, particularlyheavy and light vehicles.
Moreover, the volumes reflect vehicles billed, while, under the new IFRS, only rental revenues can be reported for vehicles sold with a buy-back
commitment, with the total rent being equal to the difference between the sale price and the buy-back price, which is then allocated over the
termof the contract. Consequently, sales volumes might not correlate immediately with revenue volumes.
During the year, Iveco delivered a total of 172,500 vehicles (15,400 of which sold with buy-back commitments), up 6.3% from 2004. A total
of 134,900 vehicles, or a 2.3% increase over 2004, were delivered in Western Europe, where the Sector benefited from the general growth
recorded in all markets with the exception of Italy.The significant increases posted in France, Germany, Spain and the United Kingdom, were
offset in part by a decrease in Italy. Sales in Latin America were quite strong.
At 10.9%, Iveco’s share of the Western European market was virtually unchanged from the prior year, despite a downturn in the medium range
segment.