Chrysler 2005 Annual Report Download - page 221
Download and view the complete annual report
Please find page 221 of the 2005 Chrysler annual report below. You can navigate through the pages in the report by either clicking on the pages listed below, or by using the keyword search tool below to find specific information within the annual report.-
 1
1 -
2
-
3
-
4
-
5
-
6
-
7
-
8
-
9
-
10
-
11
-
12
-
13
-
14
-
15
-
16
-
17
-
18
-
19
-
20
-
21
-
22
-
23
-
24
-
25
-
26
-
27
-
28
-
29
-
30
-
31
-
32
-
33
-
34
-
35
-
36
-
37
-
38
-
39
-
40
-
41
-
42
-
43
-
44
-
45
-
46
-
47
-
48
-
49
-
50
-
51
-
52
-
53
-
54
-
55
-
56
-
57
-
58
-
59
-
60
-
61
-
62
-
63
-
64
-
65
-
66
-
67
-
68
-
69
-
70
-
71
-
72
-
73
-
74
-
75
-
76
-
77
-
78
-
79
-
80
-
81
-
82
-
83
-
84
-
85
-
86
-
87
-
88
-
89
-
90
-
91
-
92
-
93
-
94
-
95
-
96
-
97
-
98
-
99
-
100
-
101
-
102
-
103
-
104
-
105
-
106
-
107
-
108
-
109
-
110
-
111
-
112
-
113
-
114
-
115
-
116
-
117
-
118
-
119
-
120
-
121
-
122
-
123
-
124
-
125
-
126
-
127
-
128
-
129
-
130
-
131
-
132
-
133
-
134
-
135
-
136
-
137
-
138
-
139
-
140
-
141
-
142
-
143
-
144
-
145
-
146
-
147
-
148
-
149
-
150
-
151
-
152
-
153
-
154
-
155
-
156
-
157
-
158
-
159
-
160
-
161
-
162
-
163
-
164
-
165
-
166
-
167
-
168
-
169
-
170
-
171
-
172
-
173
-
174
-
175
-
176
-
177
-
178
-
179
-
180
-
181
-
182
-
183
-
184
-
185
-
186
-
187
-
188
-
189
-
190
-
191
-
192
-
193
-
194
-
195
-
196
-
197
-
198
-
199
-
200
-
201
-
202
-
203
-
204
-
205
-
206
-
207
-
208
-
209
-
210
-
 211
211 -
 212
212 -
 213
213 -
 214
214 -
 215
215 -
 216
216 -
 217
217 -
 218
218 -
 219
219 -
 220
220 -
 221
221 -
 222
222 -
 223
223 -
 224
224 -
 225
225 -
 226
226 -
 227
227 -
 228
228 -
 229
229 -
 230
230 -
 231
231 -
232
-
233
-
234
-
235
-
236
-
237
-
238
-
239
-
240
-
241
-
242
-
243
-
244
-
245
-
246
-
247
-
248
-
249
-
250
-
251
-
252
-
253
-
254
-
255
-
256
-
257
-
258
-
259
-
260
-
261
-
262
-
263
-
264
-
265
-
266
-
267
-
268
-
269
-
270
-
271
-
272
-
273
-
274
-
275
-
276
-
277
-
278
 |
 |

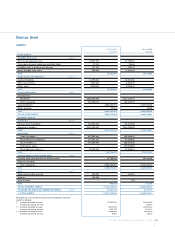
220 Fiat S.p.A. Financial Statements at December 31, 2005 - N otes to the Financial Statements
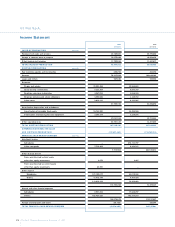
03 Fiat S.p.A.
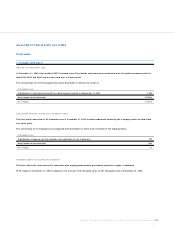
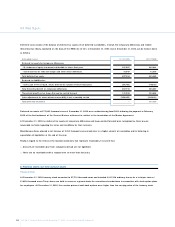
Other intangible fixed assets
They totalled 363 thousand euros at December 31, 2005 and reflect leasehold improvement costs incurred following the move of
representative offices in Rome and Brussels. These costs are amortised according to the term of the leases.
The net decrease of 7,825 thousand euros with respect to December 31, 2004 is the result of:
(in thousands of euros)
Capitalisation of leasehold improvements 373
Amortisation for the fiscal year (8,198)
N et change (7,825)
At December 31, 2004 other intangible fixed assets represented the residual amount yet to be amortised of the commissions and charges paid
for organisation of the Mandatory Convertible Facility granted in 2002 by a pool of banks arranged by Capitalia, Banca Intesa, Sanpaolo IMI, and
Unicredit Banca that was extinguished on September 20, 2005.They were amortised on a pro-rated basis according to the term of the facility.
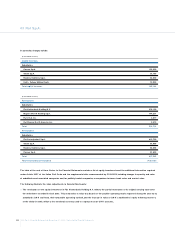
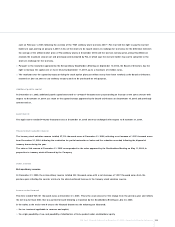
2. Property, plant and equipment
At December 31, 2005, property, plant and equipment totalled 40,734 thousand euros (43,485 thousand euros at D ecember 31, 2004).These
amounts are net of accumulated depreciation of 22,964 thousand euros at December 31, 2005 and 20,362 thousand euros at D ecember 31, 2004.
The net decrease of 2,751 thousand euros is the effect of the following items:
(in thousands of euros)
N ew capital expenditures 1,221
N et disposals (687)
Depreciation (3,285)
N et change (2,751)
Depreciation taken in 2005 was computed using the following rates:
Depreciation rates
Buildings 3%
Plant and machinery 10%
Furniture 12%
Equipment 20%
Vehicles 25%