Chrysler 2005 Annual Report Download - page 104
Download and view the complete annual report
Please find page 104 of the 2005 Chrysler annual report below. You can navigate through the pages in the report by either clicking on the pages listed below, or by using the keyword search tool below to find specific information within the annual report.-
 1
1 -
2
-
3
-
4
-
5
-
6
-
7
-
8
-
9
-
10
-
11
-
12
-
13
-
14
-
15
-
16
-
17
-
18
-
19
-
20
-
21
-
22
-
23
-
24
-
25
-
26
-
27
-
28
-
29
-
30
-
31
-
32
-
33
-
34
-
35
-
36
-
37
-
38
-
39
-
40
-
41
-
42
-
43
-
44
-
45
-
46
-
47
-
48
-
49
-
50
-
51
-
52
-
53
-
54
-
55
-
56
-
57
-
58
-
59
-
60
-
61
-
62
-
63
-
64
-
65
-
66
-
67
-
68
-
69
-
70
-
71
-
72
-
73
-
74
-
75
-
76
-
77
-
78
-
79
-
80
-
81
-
82
-
83
-
84
-
85
-
86
-
87
-
88
-
89
-
90
-
91
-
92
-
93
-
 94
94 -
 95
95 -
 96
96 -
 97
97 -
 98
98 -
 99
99 -
 100
100 -
 101
101 -
 102
102 -
 103
103 -
 104
104 -
 105
105 -
 106
106 -
 107
107 -
 108
108 -
 109
109 -
 110
110 -
 111
111 -
 112
112 -
 113
113 -
 114
114 -
115
-
116
-
117
-
118
-
119
-
120
-
121
-
122
-
123
-
124
-
125
-
126
-
127
-
128
-
129
-
130
-
131
-
132
-
133
-
134
-
135
-
136
-
137
-
138
-
139
-
140
-
141
-
142
-
143
-
144
-
145
-
146
-
147
-
148
-
149
-
150
-
151
-
152
-
153
-
154
-
155
-
156
-
157
-
158
-
159
-
160
-
161
-
162
-
163
-
164
-
165
-
166
-
167
-
168
-
169
-
170
-
171
-
172
-
173
-
174
-
175
-
176
-
177
-
178
-
179
-
180
-
181
-
182
-
183
-
184
-
185
-
186
-
187
-
188
-
189
-
190
-
191
-
192
-
193
-
194
-
195
-
196
-
197
-
198
-
199
-
200
-
201
-
202
-
203
-
204
-
205
-
206
-
207
-
208
-
209
-
210
-
211
-
212
-
213
-
214
-
215
-
216
-
217
-
218
-
219
-
220
-
221
-
222
-
223
-
224
-
225
-
226
-
227
-
228
-
229
-
230
-
231
-
232
-
233
-
234
-
235
-
236
-
237
-
238
-
239
-
240
-
241
-
242
-
243
-
244
-
245
-
246
-
247
-
248
-
249
-
250
-
251
-
252
-
253
-
254
-
255
-
256
-
257
-
258
-
259
-
260
-
261
-
262
-
263
-
264
-
265
-
266
-
267
-
268
-
269
-
270
-
271
-
272
-
273
-
274
-
275
-
276
-
277
-
278
 |
 |

103
Fiat Group Consolidated Financial Statements at December 31, 2005 - N otes to the Consolidated Financial Statements
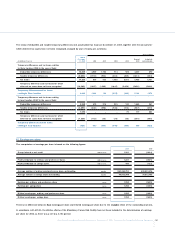
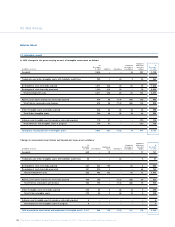
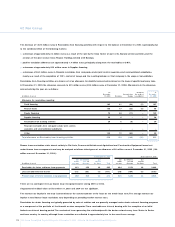
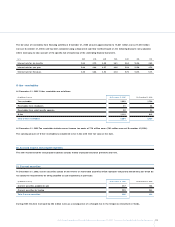
The net carrying amount of Intangible assets can be analysed as follows:
Translation
At Change in differences At
December Impairment the scope of and other D ecember
(in millions of euros) 31, 2004 Additions Amortisation losses D ivestitures consolidation changes 31, 2005
Goodwill 2,157 – – (12) – 53 220 2,418
Trademarks and other intangible assets with
indefinite useful lives 202 1 – – (1) 2 18 222
Development costs externally acquired 1,230 240 (230) (100) (7) – 22 1,155
Development costs internally generated 1,259 416 (232) (3) (2) – 10 1,448
Total Development costs 2,489 656 (462) (103) (9) – 32 2,603
Patents, concessions and licenses externally acquired 472 96 (158) – (1) (21) 81 469
Total Patents, concessions and licenses 472 96 (158) – (1) (21) 81 469
O ther intangible assets externally acquired 145 32 (69) (5) – 16 18 137
Total O ther intangible assets 145 32 (69) (5) – 16 18 137
Advances and intangible assets in progress
externally acquired 113 51 – – – – (70) 94
Total Advances and intangible assets in progress 113 51 – – – – (70) 94
Total net carrying amount of Intangible assets 5,578 836 (689) (120) (11) 50 299 5,943
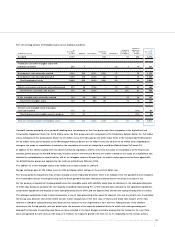
Goodwill consists principally of net goodwill resulting from the purchase of the Case group and other companies of the Agricultural and
Construction Equipment Sector for 2,016 million euros, the Pico group and other companies in the Production Systems Sector for 194 million
euros, companies in the Components Sector for 46 million euros, the Irisbus group and other minor items in the Commercial Vehicles Sector
for 56 million euros, and companies in the Metallurgical Products Sector for 37 million euros.The amount of 53 million euros regarding the
change in the scope of consolidation is related to the acquisition of control of Leasys S.p.A. and Mako Elektrik Sanayi Ve Ticaret A.S.
In addition to the effects resulting from the above-mentioned acquisitions and the entry into the scope of consolidation of the Powertrain
activities, previously part of Fiat-GM Powertrain, the joint venture with General Motors, the column Change in the scope of consolidation also
includes the reclassification to assets held for sale of the intangible assets of Atlanet S.p.A., for which a sales agreement has been signed with
the British Telecom group and approved by the antitrust authorities in February 2006.
The addition to O ther intangible assets of 32 million euros relates mainly to software.
Foreign exchange gains of 402 million euros in 2005 principally reflect changes in the euro/U.S. dollar rate.
The Group performs impairment tests at least annually, or more frequently whenever there is an indication that the goodwill may be impaired.
The recoverable amount of cash-generating units to which goodwill has been allocated is determined on the basis of its value in use.
For the purpose of impairment testing, goodwill and other intangible assets with indefinite useful lives are allocated to the cash-generating units
to which they belong. In particular, the vast majority of goodwill, representing 91% of the total, has been allocated to the agricultural equipment,
construction equipment and financial services cash-generating units in CN H, and the Systems, Pico and Service cash-generating units in Comau.
The principal assumptions made in determining value in use of cash-generating units regard the discount rate and the growth rate. In particular,
the Group uses discount rates which reflect current market assessments of the time value of money and which take account of the risks
inherent in individual cash-generating units: these pre-tax rates are in the range between 5.5% and 16%.Taking account of the detailed
structure of the Group, growth rates are based upon the forecasts of the separate industrial Sector to which each cash-generating unit
belongs.The forecasts of operating cash flows are those included in the latest budgets and plans prepared by the Group for the next three
years, extrapolated for later years on the basis of a medium- to long-term growth rate from 0% to 2% depending on the various sectors.