Chrysler 2005 Annual Report Download - page 41
Download and view the complete annual report
Please find page 41 of the 2005 Chrysler annual report below. You can navigate through the pages in the report by either clicking on the pages listed below, or by using the keyword search tool below to find specific information within the annual report.-
 1
1 -
2
-
3
-
4
-
5
-
6
-
7
-
8
-
9
-
10
-
11
-
12
-
13
-
14
-
15
-
16
-
17
-
18
-
19
-
20
-
21
-
22
-
23
-
24
-
25
-
26
-
27
-
28
-
29
-
30
-
 31
31 -
 32
32 -
 33
33 -
 34
34 -
 35
35 -
 36
36 -
 37
37 -
 38
38 -
 39
39 -
 40
40 -
 41
41 -
 42
42 -
 43
43 -
 44
44 -
 45
45 -
 46
46 -
 47
47 -
 48
48 -
 49
49 -
 50
50 -
 51
51 -
52
-
53
-
54
-
55
-
56
-
57
-
58
-
59
-
60
-
61
-
62
-
63
-
64
-
65
-
66
-
67
-
68
-
69
-
70
-
71
-
72
-
73
-
74
-
75
-
76
-
77
-
78
-
79
-
80
-
81
-
82
-
83
-
84
-
85
-
86
-
87
-
88
-
89
-
90
-
91
-
92
-
93
-
94
-
95
-
96
-
97
-
98
-
99
-
100
-
101
-
102
-
103
-
104
-
105
-
106
-
107
-
108
-
109
-
110
-
111
-
112
-
113
-
114
-
115
-
116
-
117
-
118
-
119
-
120
-
121
-
122
-
123
-
124
-
125
-
126
-
127
-
128
-
129
-
130
-
131
-
132
-
133
-
134
-
135
-
136
-
137
-
138
-
139
-
140
-
141
-
142
-
143
-
144
-
145
-
146
-
147
-
148
-
149
-
150
-
151
-
152
-
153
-
154
-
155
-
156
-
157
-
158
-
159
-
160
-
161
-
162
-
163
-
164
-
165
-
166
-
167
-
168
-
169
-
170
-
171
-
172
-
173
-
174
-
175
-
176
-
177
-
178
-
179
-
180
-
181
-
182
-
183
-
184
-
185
-
186
-
187
-
188
-
189
-
190
-
191
-
192
-
193
-
194
-
195
-
196
-
197
-
198
-
199
-
200
-
201
-
202
-
203
-
204
-
205
-
206
-
207
-
208
-
209
-
210
-
211
-
212
-
213
-
214
-
215
-
216
-
217
-
218
-
219
-
220
-
221
-
222
-
223
-
224
-
225
-
226
-
227
-
228
-
229
-
230
-
231
-
232
-
233
-
234
-
235
-
236
-
237
-
238
-
239
-
240
-
241
-
242
-
243
-
244
-
245
-
246
-
247
-
248
-
249
-
250
-
251
-
252
-
253
-
254
-
255
-
256
-
257
-
258
-
259
-
260
-
261
-
262
-
263
-
264
-
265
-
266
-
267
-
268
-
269
-
270
-
271
-
272
-
273
-
274
-
275
-
276
-
277
-
278
 |
 |

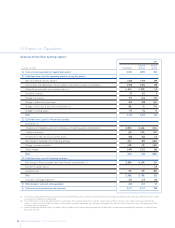
Statement of Cash Flows by Activity Segment
2005
Industrial Financial
(in millions of euros) Consolidated Activities Services
A)Cash and cash equivalents at beginning of period 5,767 4,893 873
B)Cash flows from (used in)operating activities during the period:
Net result before minority interest 1,420 1,419 249
Amortisation and depreciation (net of vehicles sold under buy-back commitments) 2,590 2,392 198
(Gains)/losses and other non-monetaryitems (a) (1,561) (1,923)114
Dividends received 47 132 3
Change in provisions 797 816 (18)
Change in deferred income taxes 394 438 (43)
Change in items due to buy-back commitments (b) (85)(7)(74)
Change in working capital 114 92 13
Total 3,716 3,359 442
C)Cash flows from (used in)investment activities:
Investments in:
- Tangible and intangible assets (net of vehicles sold under buy-back commitments) (3,052) (2,636) (416)
-Equity investments (67)(152)(33)
Proceeds from the sale of non-current assets 500 385 115
Net change in receivables from financing activities (251)409 (660)
Change in current securities (159)(19)(140)
Other changes 2,494 2,252 244
Total (535)239 (890)
D)Cash flows from (used in)financing activities:
Net change in financial payables and other financial assets/liabilities (c) (2,839)(3,159)321
Increase in capital stock (c) – – 119
Dividends paid (29)(29)(88)
Total (2,868)(3,188)352
Translation exchange differences 337 214 123
E)Total change in cash and cash equivalents 650 624 27
F)Cash and cash equivalents at end of period 6,417 5,517 900
(a) This includes, amongst other items, the unusual financial income of 858 million euros arising from the extinguishment of the Mandatory Convertible Facility and the gain of 878 million euros realised
on the sale of the investment in Italenergia Bis.
(b) The cash flows for the two periods generated by the sale of vehicles with a buy-back commitment, net of the amount already included in the result, are included in operating activities for the
period, in a single item which includes the change in working capital, investments, depreciation, gains and losses and proceeds from sales, at the end of the contract term, relating to assets included
in “Property, plant and equipment”.
(c) Net of the repayment of the Mandatory Convertible Facility of 3 billion euros and of the debt of approximately 1.8 billion euros connected with the Italenergia Bis transaction, as neither of these
gave rise to cash flows.
40 Reporton Operations Financial Review of the Group
01 Report on Operations