Chrysler 2005 Annual Report Download - page 30
Download and view the complete annual report
Please find page 30 of the 2005 Chrysler annual report below. You can navigate through the pages in the report by either clicking on the pages listed below, or by using the keyword search tool below to find specific information within the annual report.-
 1
1 -
2
-
3
-
4
-
5
-
6
-
7
-
8
-
9
-
10
-
11
-
12
-
13
-
14
-
15
-
16
-
17
-
18
-
19
-
 20
20 -
 21
21 -
 22
22 -
 23
23 -
 24
24 -
 25
25 -
 26
26 -
 27
27 -
 28
28 -
 29
29 -
 30
30 -
 31
31 -
 32
32 -
 33
33 -
 34
34 -
 35
35 -
 36
36 -
 37
37 -
 38
38 -
 39
39 -
 40
40 -
41
-
42
-
43
-
44
-
45
-
46
-
47
-
48
-
49
-
50
-
51
-
52
-
53
-
54
-
55
-
56
-
57
-
58
-
59
-
60
-
61
-
62
-
63
-
64
-
65
-
66
-
67
-
68
-
69
-
70
-
71
-
72
-
73
-
74
-
75
-
76
-
77
-
78
-
79
-
80
-
81
-
82
-
83
-
84
-
85
-
86
-
87
-
88
-
89
-
90
-
91
-
92
-
93
-
94
-
95
-
96
-
97
-
98
-
99
-
100
-
101
-
102
-
103
-
104
-
105
-
106
-
107
-
108
-
109
-
110
-
111
-
112
-
113
-
114
-
115
-
116
-
117
-
118
-
119
-
120
-
121
-
122
-
123
-
124
-
125
-
126
-
127
-
128
-
129
-
130
-
131
-
132
-
133
-
134
-
135
-
136
-
137
-
138
-
139
-
140
-
141
-
142
-
143
-
144
-
145
-
146
-
147
-
148
-
149
-
150
-
151
-
152
-
153
-
154
-
155
-
156
-
157
-
158
-
159
-
160
-
161
-
162
-
163
-
164
-
165
-
166
-
167
-
168
-
169
-
170
-
171
-
172
-
173
-
174
-
175
-
176
-
177
-
178
-
179
-
180
-
181
-
182
-
183
-
184
-
185
-
186
-
187
-
188
-
189
-
190
-
191
-
192
-
193
-
194
-
195
-
196
-
197
-
198
-
199
-
200
-
201
-
202
-
203
-
204
-
205
-
206
-
207
-
208
-
209
-
210
-
211
-
212
-
213
-
214
-
215
-
216
-
217
-
218
-
219
-
220
-
221
-
222
-
223
-
224
-
225
-
226
-
227
-
228
-
229
-
230
-
231
-
232
-
233
-
234
-
235
-
236
-
237
-
238
-
239
-
240
-
241
-
242
-
243
-
244
-
245
-
246
-
247
-
248
-
249
-
250
-
251
-
252
-
253
-
254
-
255
-
256
-
257
-
258
-
259
-
260
-
261
-
262
-
263
-
264
-
265
-
266
-
267
-
268
-
269
-
270
-
271
-
272
-
273
-
274
-
275
-
276
-
277
-
278
 |
 |

29
Report on Operations Financial Review of the Group
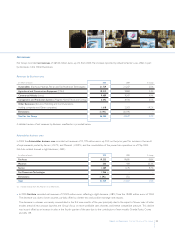
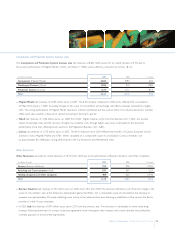
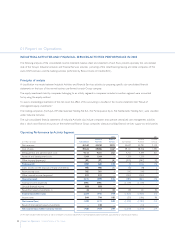
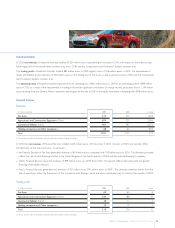
The following table illustrates the components of operating result broken down by Sector:
Gains/Losses on sales Other unusual
Trading Profit of equity investments Restructuring costs income (expenses) Operating result
(in millions of euros) 2005 2004 2005 2004 2005 2004 2005 2004 2005 2004
Fiat Auto (281) (822) –3162 355 (375) (238) (818) (1,412)
Maserati (85) (168) –––––(3) (85) (171)
Ferrari 157 138 –––––(2) 157 136
Fiat Powertrain Technologies 26 –––17 –(5)– 4–
Agricultural and Construction
Equipment (CNH) 698 467 ––87 68 ––611 399
Commercial Vehicles (Iveco) 415 371 (10)– 103 24 (13)– 289 347
Components (Magneti Marelli) 162 165 –31 33 48 (2)– 127 148
Metallurgical Products (Teksid) 45 (39) 5–14 3(9)– 27 (42)
Production Systems (Comau) 42 40 (1)– 46 10 (3)– (8)30
Services (Business Solutions) 35 41 9222 9(15)– 734
Publishing and
Communications (Itedi) 16 11 ––22 (1)–13 9
Holding companies, Other
companies and Eliminations (230) (154) 902 114 16 23 1,235 –1,891 (63)
Total for the Group 1,000 50 905 150 502 542 812 (243) 2,215 (585)
The other unusual expenses of Fiat Auto are principally connected with ongoing rationalisation and reorganisation processes, as mentioned
above. The 2005 operating result of Holding companies and Other companies includes the gain of 878 million euros resulting from the
disposal of the investment in Italenergia Bis and, under other unusual income, an amount of 1,134 million euros (net of ancillary costs)
related to the General Motors settlement.
Net income
Net financial expenses totalled 843 million euros in 2005, down from the 1,179 million euros in 2004. Moreover, the unwinding of the equity
swap on General Motors shares in 2004 resulted in a net loss of approximately 150 million euros (determined according to IFRS). This was
in addition to approximately100 million euros due to writedowns of financial receivables. Excluding these non-recurring items, the decrease is
attributable to the lower net debt of Group industrial companies, partly in consequence of the conversion of the Mandatory Convertible Facility
and the completion of the Italenergia Bis transaction but also the more efficient mix of funding, in spite of higher borrowing costs following
the rise in interest rates (particularly in the dollar zone).
Financial expenses include the interest cost component of pension plans and other employee benefits, totalling 146 million euros in 2005
(127 million euros in the previous year).