Chrysler 2005 Annual Report Download - page 114
Download and view the complete annual report
Please find page 114 of the 2005 Chrysler annual report below. You can navigate through the pages in the report by either clicking on the pages listed below, or by using the keyword search tool below to find specific information within the annual report.-
 1
1 -
2
-
3
-
4
-
5
-
6
-
7
-
8
-
9
-
10
-
11
-
12
-
13
-
14
-
15
-
16
-
17
-
18
-
19
-
20
-
21
-
22
-
23
-
24
-
25
-
26
-
27
-
28
-
29
-
30
-
31
-
32
-
33
-
34
-
35
-
36
-
37
-
38
-
39
-
40
-
41
-
42
-
43
-
44
-
45
-
46
-
47
-
48
-
49
-
50
-
51
-
52
-
53
-
54
-
55
-
56
-
57
-
58
-
59
-
60
-
61
-
62
-
63
-
64
-
65
-
66
-
67
-
68
-
69
-
70
-
71
-
72
-
73
-
74
-
75
-
76
-
77
-
78
-
79
-
80
-
81
-
82
-
83
-
84
-
85
-
86
-
87
-
88
-
89
-
90
-
91
-
92
-
93
-
94
-
95
-
96
-
97
-
98
-
99
-
100
-
101
-
102
-
103
-
 104
104 -
 105
105 -
 106
106 -
 107
107 -
 108
108 -
 109
109 -
 110
110 -
 111
111 -
 112
112 -
 113
113 -
 114
114 -
 115
115 -
 116
116 -
 117
117 -
 118
118 -
 119
119 -
 120
120 -
 121
121 -
 122
122 -
 123
123 -
 124
124 -
125
-
126
-
127
-
128
-
129
-
130
-
131
-
132
-
133
-
134
-
135
-
136
-
137
-
138
-
139
-
140
-
141
-
142
-
143
-
144
-
145
-
146
-
147
-
148
-
149
-
150
-
151
-
152
-
153
-
154
-
155
-
156
-
157
-
158
-
159
-
160
-
161
-
162
-
163
-
164
-
165
-
166
-
167
-
168
-
169
-
170
-
171
-
172
-
173
-
174
-
175
-
176
-
177
-
178
-
179
-
180
-
181
-
182
-
183
-
184
-
185
-
186
-
187
-
188
-
189
-
190
-
191
-
192
-
193
-
194
-
195
-
196
-
197
-
198
-
199
-
200
-
201
-
202
-
203
-
204
-
205
-
206
-
207
-
208
-
209
-
210
-
211
-
212
-
213
-
214
-
215
-
216
-
217
-
218
-
219
-
220
-
221
-
222
-
223
-
224
-
225
-
226
-
227
-
228
-
229
-
230
-
231
-
232
-
233
-
234
-
235
-
236
-
237
-
238
-
239
-
240
-
241
-
242
-
243
-
244
-
245
-
246
-
247
-
248
-
249
-
250
-
251
-
252
-
253
-
254
-
255
-
256
-
257
-
258
-
259
-
260
-
261
-
262
-
263
-
264
-
265
-
266
-
267
-
268
-
269
-
270
-
271
-
272
-
273
-
274
-
275
-
276
-
277
-
278
 |
 |

113
Fiat Group Consolidated Financial Statements at December 31, 2005 - N otes to the Consolidated Financial Statements
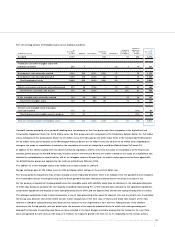
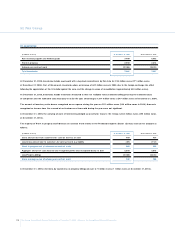
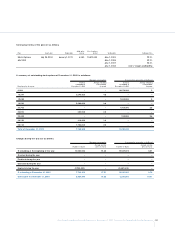
The fair value of receivables from financing activities at December 31, 2005 amounts approximately to 15,821 million euros (17,460 million
euros at D ecember 31, 2004) and has been calculated using a discounted cash flow method based on the following discount rates, adjusted,
where necessary, to take account of the specific risk of insolvency of the underlying financial instrument.
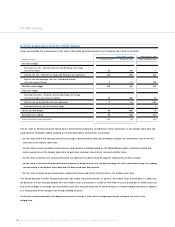
In % EUR USD GBP C AD AUD BRL PLN
Interest rate for six months 2.64 4.70 4.59 3.81 5.64 16.06 4.60
Interest rate for one year 2.84 4.84 4.57 4.06 5.58 15.58 4.70
Interest rate for five years 3.22 4.88 4.54 4.18 5.70 14.73 5.15
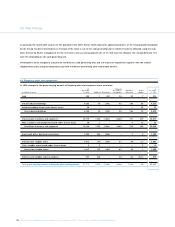
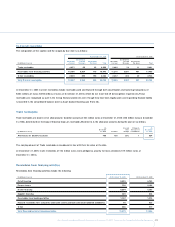
O ther receivables
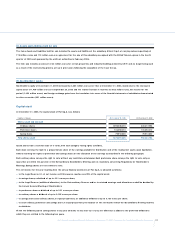
At December 31, 2005 O ther receivables are as follows:
(in millions of euros) At D ecember 31, 2005 At D ecember 31, 2004
Tax receivables 1,903 1,759
Receivables from employees 41 38
Receivables from social security agencies 30 25
O ther 1,110 912
Total O ther receivables 3,084 2,734
At December 31, 2005 Tax receivables include current income tax assets of 778 million euros (780 million euros at D ecember 31,2004).
The carrying amount of O ther receivables is considered to be in line with their fair value at the date.
20.Accrued income and prepaid expenses
The item Accrued income and prepaid expenses consists mainly of prepaid insurance premiums and rent.
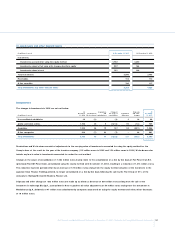
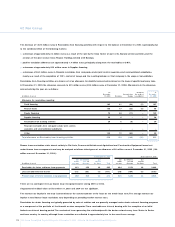
21. Current securities
At December 31, 2005, current securities consist of short-term or marketable securities which represent temporary investments, but which do
not satisfy the requirements for being classified as cash equivalents. In particular:
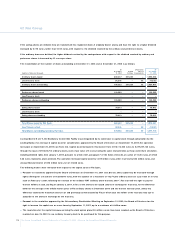
(in millions of euros) At D ecember 31, 2005 At D ecember 31, 2004
Current securities available-for-sale 317 108
Current securities for trading 239 245
Total Current securities 556 353
During 2005 this item increased by 203 million euros as a consequence of a changed mix in the temporary investment of funds.