Chrysler 2005 Annual Report Download - page 215
Download and view the complete annual report
Please find page 215 of the 2005 Chrysler annual report below. You can navigate through the pages in the report by either clicking on the pages listed below, or by using the keyword search tool below to find specific information within the annual report.-
 1
1 -
2
-
3
-
4
-
5
-
6
-
7
-
8
-
9
-
10
-
11
-
12
-
13
-
14
-
15
-
16
-
17
-
18
-
19
-
20
-
21
-
22
-
23
-
24
-
25
-
26
-
27
-
28
-
29
-
30
-
31
-
32
-
33
-
34
-
35
-
36
-
37
-
38
-
39
-
40
-
41
-
42
-
43
-
44
-
45
-
46
-
47
-
48
-
49
-
50
-
51
-
52
-
53
-
54
-
55
-
56
-
57
-
58
-
59
-
60
-
61
-
62
-
63
-
64
-
65
-
66
-
67
-
68
-
69
-
70
-
71
-
72
-
73
-
74
-
75
-
76
-
77
-
78
-
79
-
80
-
81
-
82
-
83
-
84
-
85
-
86
-
87
-
88
-
89
-
90
-
91
-
92
-
93
-
94
-
95
-
96
-
97
-
98
-
99
-
100
-
101
-
102
-
103
-
104
-
105
-
106
-
107
-
108
-
109
-
110
-
111
-
112
-
113
-
114
-
115
-
116
-
117
-
118
-
119
-
120
-
121
-
122
-
123
-
124
-
125
-
126
-
127
-
128
-
129
-
130
-
131
-
132
-
133
-
134
-
135
-
136
-
137
-
138
-
139
-
140
-
141
-
142
-
143
-
144
-
145
-
146
-
147
-
148
-
149
-
150
-
151
-
152
-
153
-
154
-
155
-
156
-
157
-
158
-
159
-
160
-
161
-
162
-
163
-
164
-
165
-
166
-
167
-
168
-
169
-
170
-
171
-
172
-
173
-
174
-
175
-
176
-
177
-
178
-
179
-
180
-
181
-
182
-
183
-
184
-
185
-
186
-
187
-
188
-
189
-
190
-
191
-
192
-
193
-
194
-
195
-
196
-
197
-
198
-
199
-
200
-
201
-
202
-
203
-
204
-
 205
205 -
 206
206 -
 207
207 -
 208
208 -
 209
209 -
 210
210 -
 211
211 -
 212
212 -
 213
213 -
 214
214 -
 215
215 -
 216
216 -
 217
217 -
 218
218 -
 219
219 -
 220
220 -
 221
221 -
 222
222 -
 223
223 -
 224
224 -
 225
225 -
226
-
227
-
228
-
229
-
230
-
231
-
232
-
233
-
234
-
235
-
236
-
237
-
238
-
239
-
240
-
241
-
242
-
243
-
244
-
245
-
246
-
247
-
248
-
249
-
250
-
251
-
252
-
253
-
254
-
255
-
256
-
257
-
258
-
259
-
260
-
261
-
262
-
263
-
264
-
265
-
266
-
267
-
268
-
269
-
270
-
271
-
272
-
273
-
274
-
275
-
276
-
277
-
278
 |
 |

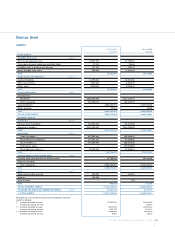
214 Fiat S.p.A. Financial Statements at December 31, 2005
03 Fiat S.p.A.
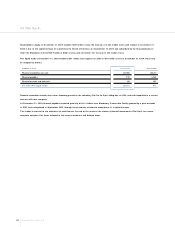
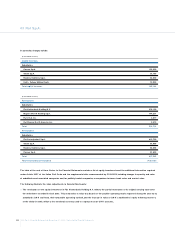
Income Statement
2005 2004
(in euros)(in euros)
VALUE O F PROD UCTION (note 15)
Revenues from sales and services 20,169,500 59,775,406
Change in contract work in progress 13,575,898 16,859,476
O ther income and revenues 11,702,535 11,851,617
TOTAL VALUE O F PROD UCTION 45,447,933 88,486,499
CO STS OF PRO DUCTIO N (note 16)
Raw materials, supplies and merchandise 406,725 423,376
Services 76,217,668 109,849,162
Leases and rentals 987,596 949,056
Personnel
W ages and salaries 22,992,468 29,980,662
Social security contributions 7,222,924 9,873,787
Employee severance indemnities 4,087,033 4,088,328
Employee pensions and similar obligations 3,590,586 2,189,912
O ther costs 3,812,121 6,745,987
41,705,132 52,878,676
Amortisation, depreciation and writedowns
Amortisation of intangible fixed assets 23,745,920 26,496,908
Depreciation of property, plant and equipment 3,285,314 3,220,295
27,031,234 29,717,203
O ther operating costs 40,701,141 13,451,449
TOTAL COSTS OF PRO DUCTIO N 187,049,496 207,268,922
DIFFERENCE BETW EEN THE VALUE
AN D CO STS OF PRO DUCTIO N (141,601,563) (118,782,423)
FIN AN CIAL IN COME AN D EXPENSES (note 17)
Investment income
Subsidiaries – 676,123,797
O ther companies 7,713,904 6,433,015
7,713,904 682,556,812
O ther financial income
From securities held as fixed assets
other than equity investments 2,072 2,467
From securities held as current assets
other than equity investments 85,750 –
O ther income
Subsidiaries 101,199,017 63,019,390
O thers 11,415,199 9,955,470
112,614,216 72,974,860
112,702,038 72,977,327
Interest and other financial expenses
Subsidiaries 2,941,624 17,686,797
O thers 165,735,025 192,535,010
168,676,649 210,221,807
Foreign exchange gains and losses (58,155) 283,349
TOTAL FIN AN CIAL IN COME AN D EXPENSES (48,318,862) 545,595,681