Chrysler 2005 Annual Report Download - page 28
Download and view the complete annual report
Please find page 28 of the 2005 Chrysler annual report below. You can navigate through the pages in the report by either clicking on the pages listed below, or by using the keyword search tool below to find specific information within the annual report.-
 1
1 -
2
-
3
-
4
-
5
-
6
-
7
-
8
-
9
-
10
-
11
-
12
-
13
-
14
-
15
-
16
-
17
-
 18
18 -
 19
19 -
 20
20 -
 21
21 -
 22
22 -
 23
23 -
 24
24 -
 25
25 -
 26
26 -
 27
27 -
 28
28 -
 29
29 -
 30
30 -
 31
31 -
 32
32 -
 33
33 -
 34
34 -
 35
35 -
 36
36 -
 37
37 -
 38
38 -
39
-
40
-
41
-
42
-
43
-
44
-
45
-
46
-
47
-
48
-
49
-
50
-
51
-
52
-
53
-
54
-
55
-
56
-
57
-
58
-
59
-
60
-
61
-
62
-
63
-
64
-
65
-
66
-
67
-
68
-
69
-
70
-
71
-
72
-
73
-
74
-
75
-
76
-
77
-
78
-
79
-
80
-
81
-
82
-
83
-
84
-
85
-
86
-
87
-
88
-
89
-
90
-
91
-
92
-
93
-
94
-
95
-
96
-
97
-
98
-
99
-
100
-
101
-
102
-
103
-
104
-
105
-
106
-
107
-
108
-
109
-
110
-
111
-
112
-
113
-
114
-
115
-
116
-
117
-
118
-
119
-
120
-
121
-
122
-
123
-
124
-
125
-
126
-
127
-
128
-
129
-
130
-
131
-
132
-
133
-
134
-
135
-
136
-
137
-
138
-
139
-
140
-
141
-
142
-
143
-
144
-
145
-
146
-
147
-
148
-
149
-
150
-
151
-
152
-
153
-
154
-
155
-
156
-
157
-
158
-
159
-
160
-
161
-
162
-
163
-
164
-
165
-
166
-
167
-
168
-
169
-
170
-
171
-
172
-
173
-
174
-
175
-
176
-
177
-
178
-
179
-
180
-
181
-
182
-
183
-
184
-
185
-
186
-
187
-
188
-
189
-
190
-
191
-
192
-
193
-
194
-
195
-
196
-
197
-
198
-
199
-
200
-
201
-
202
-
203
-
204
-
205
-
206
-
207
-
208
-
209
-
210
-
211
-
212
-
213
-
214
-
215
-
216
-
217
-
218
-
219
-
220
-
221
-
222
-
223
-
224
-
225
-
226
-
227
-
228
-
229
-
230
-
231
-
232
-
233
-
234
-
235
-
236
-
237
-
238
-
239
-
240
-
241
-
242
-
243
-
244
-
245
-
246
-
247
-
248
-
249
-
250
-
251
-
252
-
253
-
254
-
255
-
256
-
257
-
258
-
259
-
260
-
261
-
262
-
263
-
264
-
265
-
266
-
267
-
268
-
269
-
270
-
271
-
272
-
273
-
274
-
275
-
276
-
277
-
278
 |
 |

27
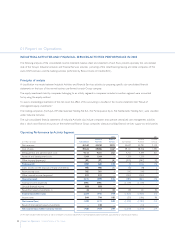
Report on Operations Financial Review of the Group
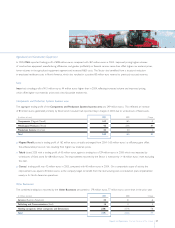
Agricultural and Construction Equipment
In 2005, CNH reported trading profit of 698 million euros, compared with 467 million euros in 2004. Improved pricing, higher volumes
of construction equipment, manufacturing efficiencies, and greater profitability in financial services more than offset higher raw material prices,
lower volumes in the agricultural equipment segment and increased R&D costs. The Sector also benefited from a structural reduction
in employee healthcare costs in North America, which also resulted in a positive 83 million euro reversal to previously accrued reserves.
Iveco
Iveco had a trading profit of 415 million euros, 44 million euros higher than in 2004, reflecting increased volume and improved pricing,
which offset higher raw materials prices and a less favourable market mix.
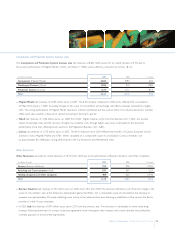
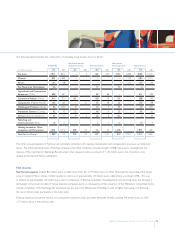
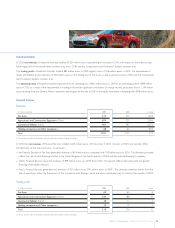
Components and Production Systems business area
The aggregate trading profit of the Components and Production Systems business area was 249 million euros. This reflected an increase
of 83 million euros, generated primarily by Teksid which however had reported major charges in 2004 due to write-downs of fixed assets.
(in millions of euros) 2005 2004 Change
Components (Magneti Marelli) 162 165 -3
Metallurgical Products (Teksid) 45 (39) 84
Production Systems (Comau) 42 40 2
Total 249 166 83
Magneti Marelli posted a trading profit of 162 million euros, virtually unchanged from 2004 (165 million euros) as efficiency gains offset
the unfavourable price-cost ratio resulting from higher raw materials prices.
Teksid closed 2005 with a trading profit of 45 million euros, against a trading loss of 39 million euros in 2004, which was impacted by
writedowns of fixed assets for 68 million euros.The improvement reported by the Sector is noteworthy (+16 million euros) even excluding
this item.
Comau’s trading profit was 42 million euros in 2005, compared with 40 million euros in 2004. On a comparable scope of activity, the
improvement was equal to 8 million euros, as the companybegan to benefit from the restructuring and cost-reduction plans implemented
mainly in its North American operations.
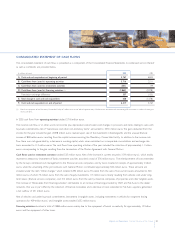
Other Businesses
The combined trading loss reported bythe Other Businesses amounted to 179 million euros, 77 million euros worse than in the prior year.
(in millions of euros) 2005 2004 Change
Services (Business Solutions) 35 41 -6
Publishing and Communications (Itedi) 16 11 5
Holding companies, Other companies and Eliminations (230) (154) -76
Total (179) (102) -77