Chrysler 2005 Annual Report Download - page 35
Download and view the complete annual report
Please find page 35 of the 2005 Chrysler annual report below. You can navigate through the pages in the report by either clicking on the pages listed below, or by using the keyword search tool below to find specific information within the annual report.-
 1
1 -
2
-
3
-
4
-
5
-
6
-
7
-
8
-
9
-
10
-
11
-
12
-
13
-
14
-
15
-
16
-
17
-
18
-
19
-
20
-
21
-
22
-
23
-
24
-
 25
25 -
 26
26 -
 27
27 -
 28
28 -
 29
29 -
 30
30 -
 31
31 -
 32
32 -
 33
33 -
 34
34 -
 35
35 -
 36
36 -
 37
37 -
 38
38 -
 39
39 -
 40
40 -
 41
41 -
 42
42 -
 43
43 -
 44
44 -
 45
45 -
46
-
47
-
48
-
49
-
50
-
51
-
52
-
53
-
54
-
55
-
56
-
57
-
58
-
59
-
60
-
61
-
62
-
63
-
64
-
65
-
66
-
67
-
68
-
69
-
70
-
71
-
72
-
73
-
74
-
75
-
76
-
77
-
78
-
79
-
80
-
81
-
82
-
83
-
84
-
85
-
86
-
87
-
88
-
89
-
90
-
91
-
92
-
93
-
94
-
95
-
96
-
97
-
98
-
99
-
100
-
101
-
102
-
103
-
104
-
105
-
106
-
107
-
108
-
109
-
110
-
111
-
112
-
113
-
114
-
115
-
116
-
117
-
118
-
119
-
120
-
121
-
122
-
123
-
124
-
125
-
126
-
127
-
128
-
129
-
130
-
131
-
132
-
133
-
134
-
135
-
136
-
137
-
138
-
139
-
140
-
141
-
142
-
143
-
144
-
145
-
146
-
147
-
148
-
149
-
150
-
151
-
152
-
153
-
154
-
155
-
156
-
157
-
158
-
159
-
160
-
161
-
162
-
163
-
164
-
165
-
166
-
167
-
168
-
169
-
170
-
171
-
172
-
173
-
174
-
175
-
176
-
177
-
178
-
179
-
180
-
181
-
182
-
183
-
184
-
185
-
186
-
187
-
188
-
189
-
190
-
191
-
192
-
193
-
194
-
195
-
196
-
197
-
198
-
199
-
200
-
201
-
202
-
203
-
204
-
205
-
206
-
207
-
208
-
209
-
210
-
211
-
212
-
213
-
214
-
215
-
216
-
217
-
218
-
219
-
220
-
221
-
222
-
223
-
224
-
225
-
226
-
227
-
228
-
229
-
230
-
231
-
232
-
233
-
234
-
235
-
236
-
237
-
238
-
239
-
240
-
241
-
242
-
243
-
244
-
245
-
246
-
247
-
248
-
249
-
250
-
251
-
252
-
253
-
254
-
255
-
256
-
257
-
258
-
259
-
260
-
261
-
262
-
263
-
264
-
265
-
266
-
267
-
268
-
269
-
270
-
271
-
272
-
273
-
274
-
275
-
276
-
277
-
278
 |
 |

34 Reporton Operations Financial Review of the Group
01 Report on Operations
INDUSTRIAL ACTIVITIES AND FINANCIAL SERVICES ACTIVITIES: PERFORMANCE IN 2005
The following analyses of the consolidated income statement, balance sheet and statement of cash flows present separately the consolidated
data of the Group’s Industrial Activities and Financial Services activities (consisting of the retail financing, leasing, and rental companies of Fiat
Auto, CNH and Iveco and the banking activities performed by Banca Unione di Credito-BUC).
Principles of analysis
Aclassification was made between Industrial Activities and Financial Services activities by preparing specific sub-consolidated financial
statements on the basis of the normal business performed by each Group company.
The equity investments held bycompanies belonging to an activity segment in companies included in another segment were accounted
for by using the equity method.
To avoid a misleading presentation of the net result, the effect of this accounting is classified in the income statement item “Result of
intersegment equity investments.”
The holding companies (Fiat S.p.A., IHF-Internazionale Holding Fiat S.A., Fiat Partecipazioni S.p.A., Fiat Netherlands Holding N.V.) were classified
under Industrial Activities.
The sub-consolidated financial statements of Industrial Activities also include companies that operate centralised cash management activities,
that is which raise financial resources on the market and finance Group companies without providing financial services support to third parties.
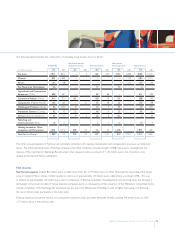
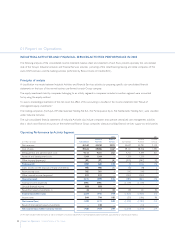
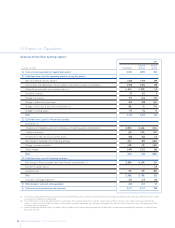
Operating Performance by Activity Segment
2005 2004
Industrial Financial Industrial Financial
(in millions of euros) Consolidated Activities Services Consolidated Activities Services
Net revenues 46,544 45,350 2,023 45,637 44,291 2,123
Cost of sales 39,624 39,006 1,447 39,121 38,306 1,592
Selling, general and administrative costs 4,513 4,261 252 4,701 4,394 307
Research and development costs 1,364 1,364 – 1,350 1,350 –
Other income (expenses) (43)(37)(6) (415) (467) 52
Trading profit 1,000 682 318 50 (226) 276
Gains (losses) on the disposal of equity investments 905 906 (1) 150 148 2
Restructuring costs 502 501 1 542 540 2
Other unusual income (expenses) 812 812 – (243) (243) –
Operating result 2,215 1,899 316 (585) (861) 276
Financial income (expenses) (843) (843)–(1,179) (1,179) –
Unusual financial income 858 858 – –––
Result from equity investments (*) 34 1 33 135 101 34
Income/(loss)before taxes 2,264 1,915 349 (1,629) (1,939) 310
Income taxes 844 744 100 (50) (146) 96
Net income/(loss)1,420 1,171 249 (1,579) (1,793) 214
Result of intersegment equity investments – 248 – – 214 –
Net income/(loss)beforeminority interest 1,420 1,419 249 (1,579) (1,579) 214
(*) This item includes investment income as well as writedowns and upward adjustments in non-intersegment equity investments accounted for by using the equity method.