Chrysler 2005 Annual Report Download - page 244
Download and view the complete annual report
Please find page 244 of the 2005 Chrysler annual report below. You can navigate through the pages in the report by either clicking on the pages listed below, or by using the keyword search tool below to find specific information within the annual report.-
 1
1 -
2
-
3
-
4
-
5
-
6
-
7
-
8
-
9
-
10
-
11
-
12
-
13
-
14
-
15
-
16
-
17
-
18
-
19
-
20
-
21
-
22
-
23
-
24
-
25
-
26
-
27
-
28
-
29
-
30
-
31
-
32
-
33
-
34
-
35
-
36
-
37
-
38
-
39
-
40
-
41
-
42
-
43
-
44
-
45
-
46
-
47
-
48
-
49
-
50
-
51
-
52
-
53
-
54
-
55
-
56
-
57
-
58
-
59
-
60
-
61
-
62
-
63
-
64
-
65
-
66
-
67
-
68
-
69
-
70
-
71
-
72
-
73
-
74
-
75
-
76
-
77
-
78
-
79
-
80
-
81
-
82
-
83
-
84
-
85
-
86
-
87
-
88
-
89
-
90
-
91
-
92
-
93
-
94
-
95
-
96
-
97
-
98
-
99
-
100
-
101
-
102
-
103
-
104
-
105
-
106
-
107
-
108
-
109
-
110
-
111
-
112
-
113
-
114
-
115
-
116
-
117
-
118
-
119
-
120
-
121
-
122
-
123
-
124
-
125
-
126
-
127
-
128
-
129
-
130
-
131
-
132
-
133
-
134
-
135
-
136
-
137
-
138
-
139
-
140
-
141
-
142
-
143
-
144
-
145
-
146
-
147
-
148
-
149
-
150
-
151
-
152
-
153
-
154
-
155
-
156
-
157
-
158
-
159
-
160
-
161
-
162
-
163
-
164
-
165
-
166
-
167
-
168
-
169
-
170
-
171
-
172
-
173
-
174
-
175
-
176
-
177
-
178
-
179
-
180
-
181
-
182
-
183
-
184
-
185
-
186
-
187
-
188
-
189
-
190
-
191
-
192
-
193
-
194
-
195
-
196
-
197
-
198
-
199
-
200
-
201
-
202
-
203
-
204
-
205
-
206
-
207
-
208
-
209
-
210
-
211
-
212
-
213
-
214
-
215
-
216
-
217
-
218
-
219
-
220
-
221
-
222
-
223
-
224
-
225
-
226
-
227
-
228
-
229
-
230
-
231
-
232
-
233
-
 234
234 -
 235
235 -
 236
236 -
 237
237 -
 238
238 -
 239
239 -
 240
240 -
 241
241 -
 242
242 -
 243
243 -
 244
244 -
 245
245 -
 246
246 -
 247
247 -
 248
248 -
 249
249 -
 250
250 -
 251
251 -
 252
252 -
 253
253 -
 254
254 -
255
-
256
-
257
-
258
-
259
-
260
-
261
-
262
-
263
-
264
-
265
-
266
-
267
-
268
-
269
-
270
-
271
-
272
-
273
-
274
-
275
-
276
-
277
-
278
 |
 |

243
Fiat S.p.A. Financial Statements at D ecember 31, 2005 - N otes to the Financial Statements
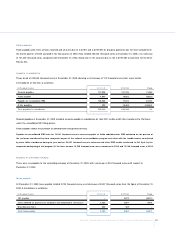
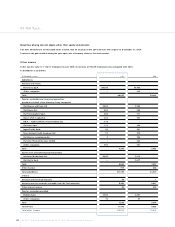
In 2005, taxes represented 55.6% of income before taxes, and the difference with respect to the theoretical IRES rate of 33% is due mainly to
the negative effect (28.2%) of impairment adjustments to financial assets (net writedowns of equity investments) carried out in the fiscal year
that are not tax deductible, partially balanced by the positive effect (-5.6%) of tax losses carried forward and temporary differences that arose
in previous years but, on a prudential basis, have not been accounted for as deferred tax assets.
In 2004, taxes represented 22.7% of income before taxes, and the difference with respect to the theoretical IRES rate of 33% was due mainly to
the negative effect of writedowns of equity investments carried out in the fiscal year that are not tax deductible, but partially balanced by the
positive effect of deferred tax assets posted in consequence of temporary differences that arose in previous years and tax losses carried forward.
Finally, taxable income for IRAP was negative in 2005 as in 2004.
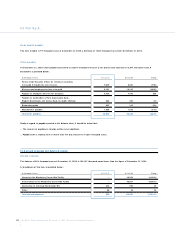
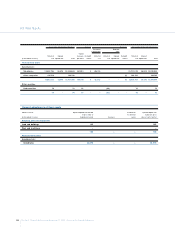
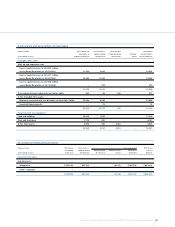
AN ALYSIS O F FIXED ASSETS AN D SUPPLEMEN TAL IN FO RMATIO N
Cost of fixed assets
Gross value at beginning of fiscal year Increases Decreases Gross value at the end of fiscal year
Disposals, sales and
contributions
Historical Upward Reclassifi- Reclassifi- Historical Upward Historical Upward
(in thousands of euros) cost adjustments Total cations Purchases cations cost adjustments cost adjustments Total
Intangible fixed assets
Start-up and expansion costs:
Cost of capital increase to
3,082.13 million euros
(Board Resolution of 12/10/01) 19,224 19,224 19,224 19,224
Cost of capital increase to
4,918.11 million euros
(Board Resolution of 06/26/03) 56,729 56,729 56,729 56,729
Cost of capital increase to
6,377.26 million euros
(Board Resolution of 09/15/05) – – 1,363 1,363 1,363
75,953 – 75,953 – 1,363 – – – 77,316 – 77,316
Concessions, licenses, trademarks
and similar rights 897 897 28 94 (16) 1,003 1,003
Intangible assets in progress and advances 185 185 65 (28) (1) 221 221
O ther Intangible fixed assets
Expenses connected with the
Mandatory Convertible Facility 33,628 33,628 33,628 33,628
Leasehold improvements – – 373 373 373
110,663 – 110,663 28 1,895 (28) (17) – 112,541 – 112,541
Property, plant and equipment
Land and buildings 45,945 102 46,047 45,945 102 46,047
Plant and machinery 10,057 10,057 30 10,087 10,087
O ther fixed assets 7,743 7,743 1,191 (1,370) 7,564 7,564
63,745 102 63,847 – 1,221 – (1,370)– 63,596 102 63,698