Chrysler 2005 Annual Report Download - page 39
Download and view the complete annual report
Please find page 39 of the 2005 Chrysler annual report below. You can navigate through the pages in the report by either clicking on the pages listed below, or by using the keyword search tool below to find specific information within the annual report.-
 1
1 -
2
-
3
-
4
-
5
-
6
-
7
-
8
-
9
-
10
-
11
-
12
-
13
-
14
-
15
-
16
-
17
-
18
-
19
-
20
-
21
-
22
-
23
-
24
-
25
-
26
-
27
-
28
-
 29
29 -
 30
30 -
 31
31 -
 32
32 -
 33
33 -
 34
34 -
 35
35 -
 36
36 -
 37
37 -
 38
38 -
 39
39 -
 40
40 -
 41
41 -
 42
42 -
 43
43 -
 44
44 -
 45
45 -
 46
46 -
 47
47 -
 48
48 -
 49
49 -
50
-
51
-
52
-
53
-
54
-
55
-
56
-
57
-
58
-
59
-
60
-
61
-
62
-
63
-
64
-
65
-
66
-
67
-
68
-
69
-
70
-
71
-
72
-
73
-
74
-
75
-
76
-
77
-
78
-
79
-
80
-
81
-
82
-
83
-
84
-
85
-
86
-
87
-
88
-
89
-
90
-
91
-
92
-
93
-
94
-
95
-
96
-
97
-
98
-
99
-
100
-
101
-
102
-
103
-
104
-
105
-
106
-
107
-
108
-
109
-
110
-
111
-
112
-
113
-
114
-
115
-
116
-
117
-
118
-
119
-
120
-
121
-
122
-
123
-
124
-
125
-
126
-
127
-
128
-
129
-
130
-
131
-
132
-
133
-
134
-
135
-
136
-
137
-
138
-
139
-
140
-
141
-
142
-
143
-
144
-
145
-
146
-
147
-
148
-
149
-
150
-
151
-
152
-
153
-
154
-
155
-
156
-
157
-
158
-
159
-
160
-
161
-
162
-
163
-
164
-
165
-
166
-
167
-
168
-
169
-
170
-
171
-
172
-
173
-
174
-
175
-
176
-
177
-
178
-
179
-
180
-
181
-
182
-
183
-
184
-
185
-
186
-
187
-
188
-
189
-
190
-
191
-
192
-
193
-
194
-
195
-
196
-
197
-
198
-
199
-
200
-
201
-
202
-
203
-
204
-
205
-
206
-
207
-
208
-
209
-
210
-
211
-
212
-
213
-
214
-
215
-
216
-
217
-
218
-
219
-
220
-
221
-
222
-
223
-
224
-
225
-
226
-
227
-
228
-
229
-
230
-
231
-
232
-
233
-
234
-
235
-
236
-
237
-
238
-
239
-
240
-
241
-
242
-
243
-
244
-
245
-
246
-
247
-
248
-
249
-
250
-
251
-
252
-
253
-
254
-
255
-
256
-
257
-
258
-
259
-
260
-
261
-
262
-
263
-
264
-
265
-
266
-
267
-
268
-
269
-
270
-
271
-
272
-
273
-
274
-
275
-
276
-
277
-
278
 |
 |

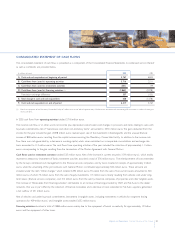
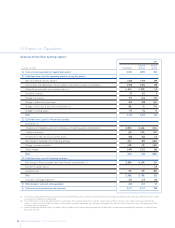
Net Debt by Activity Segment
At 12.31.2005 At 12.31.2004
Industrial Financial Industrial Financial
(in millions of euros) Consolidated Activities Services Consolidated Activities Services
Debt (25,761)(13,782)(16,915) (32,191) (22,039) (17,808)
-Asset-backed financing (10,210)(1,531)(8,945) (10,174) (2,622) (7,914)
-Other debt (15,551)(12,251)(7,970) (22,017) (19,417) (9,894)
Intersegment financial receivables – 4,594 342 – 6,823 771
Financial payables net of intersegment balances (25,761)(9,188)(16,573) (32,191) (15,216) (17,037)
Other financial assets (1) 454 428 26 851 814 26
Other financial liabilities (1) (189) (180) (9) (203) (177) (27)
Current securities 556 204 352 353 239 189
Cash and cash equivalents 6,417 5,517 900 5.767 4,893 873
Net debt (18,523) (3,219) (15,304) (25,423) (9,447) (15,976)
(1) This item includes the asset and liability fair values of derivative financial instruments.
“Financial payables” under Industrial Activities partly include funds raised by the central cash management and transferred to financial services
companies in supportof their activity (represented under the item “Intersegment financial receivables”).
“Intersegment financial receivables” in financial services companies represent loans or advances to industrial companies, mainly relating to
the sales of receivables by industrial to financial companies in transactions that do not comply with the requirements of IAS 39 for recognition
of those sales.
“Cash and cash equivalents” include approximately 700 million euros at December 31, 2005 (approximately 600 million euros at
December 31, 2004) mainly relating to financial services companies and allocated to service the debt for securitisation structures, classified
as “Asset-backed financing.”
The net debt of financial services companies at December 31, 2005 was 672 million euros lower than at December 31, 2004.This decrease
is mainlyattributable to the sale of the Iveco financial services companies within the context of the Barclays transaction, partly offset by the
net increase of the financed portfolio and the effect of foreign currency translation differences.
38 Reporton Operations Financial Review of the Group
01 Report on Operations